FWP: Filing under Securities Act Rules 163/433 of free writing prospectuses
Published on February 7, 2025
Free Writing Prospectus
Filed Pursuant to Rule 433
Registration Statement No. 333-284419
February 7, 2025

Investor Presentation February 2025 CONFIDENTIAL

Disclaimer This investor presentation (this “Investor Presentation”) relates to the proposed initial public offering of shares of voting common stock of Northpointe Bancshares, Inc . (the “Company,” “we,” “our”, “us” or “NPB”) and should be read together with the Registration Statement on Form S - 1 (File No . 333 - 284419 ) (the “Registration Statement”) that we filed with the U . S . Securities and Exchange Commission (the “SEC”) for the offering to which this presentation relates . This Investor Presentation has been prepared by us solely for informational purposes and does not purport to contain all of the information that may be material or relevant to an investment decision . In addition, certain financial information presented in this Investor Presentation has not been audited . The contents of this Investor Presentation should not be construed as investment, legal or tax advice . The Registration Statement has not yet become effective . Before you invest, you should read the preliminary prospectus included in the Registration Statement (the “Preliminary Prospectus”), including the risk factors described therein, and, when available, the final prospectus relating to the offering, and the other documents we have filed with the SEC in their entirety for more complete information about the Company and the offering to which this Investor Presentation relates . You may obtain these documents, including the Preliminary Prospectus, for free by visiting EDGAR on the Sec website at http : //www . sec . gov . Alternatively, you may also request a copy of the Preliminary Prospectus and, when available, the final prospectus from Keefe, Bruyette & Woods, Inc . , by calling toll - free ( 800 ) 966 - 1559 . This Investor Presentation does not constitute an offer to sell, nor a solicitation of an offer to buy, any securities by any person in any jurisdiction in which it is unlawful for such a person to make such an offering or solicitation . Forward Looking Statements This Investor Presentation contains forward - looking statements as defined in the Private Securities Litigation Reform Act of 1995 . Words or phrases such as “may,” “should,” “could,” “predict,” “potential,” “believe,” “will likely result,” “expect,” “continue,” “will,” “anticipate,” “seek,” “estimate,” “intend,” “plan,” “projection,” “would” and “outlook,” or the negative version of those words or other comparable words are intended to identify forward - looking statements but are not the exclusive means of identifying such statements . These forward - looking statements are not historical facts, and are based on current expectations, estimates and projections about the Company’s business based on the beliefs of and certain assumptions made by the Company’s management, many of which assumptions, by their nature, are inherently uncertain and beyond the Company’s control . Accordingly, you are cautioned that any such forward - looking statements are not guarantees of future performance and are subject to certain risks, uncertainties and assumptions that are difficult to predict . The forward - looking statements contained herein are made only as of the date of this presentation . Although the Company believes that the expectations reflected in such forward - looking statements are reasonable as of the date made, they may prove to be materially different from the results expressed or implied by such forward - looking statements . Unless required by law, the Company also disclaims any obligation to update any forward - looking statements . Interested parties should not place undue reliance on any forward - looking statement and should carefully consider the risks and other factors that the Company faces . Industry Information Certain of the information contained in this Investor Presentation may be derived from information provided by industry sources . The Company believes that such information is accurate and that the sources from which it has been obtained are reliable . The Company cannot guarantee the accuracy of such information . By attending this presentation, you acknowledge that you will be solely responsible for your own assessment of the market and our market position and that you will conduct your own analysis and be solely responsible for forming your own view of the potential future performance of our business . Our and Northpointe Bank’s, our wholly - owned subsidiary and Michigan non - member bank (our “Bank”) logos and other trademarks referred to and included in this Investor Presentation belong to us . Solely for convenience, we may refer to our trademarks herein without the “®“ “SM” or the “TM” symbols, but such references are not intended to indicate that we will not assert, to the fullest extent under applicable law, our rights to our trademarks . Non - GAAP Financial Measures In addition to results presented in accordance with U . S . generally accepted accounting principles (“GAAP”), this presentation contains certain non - GAAP financial measures . The Company believes that providing certain non - GAAP financial measures provides investors with information useful in understanding our financial performance, performance trends and financial position . Our management uses these measures for internal planning and forecasting purposes and we believe that our presentation and discussion, together with the accompanying reconciliations, allows investors, security analysts and other interested parties to view our performance and the factors and trends affecting our business in a manner similar to management . These non - GAAP measures should not be considered a substitute for GAAP measures and we strongly encourage investors to review our consolidated financial statements in their entirety and not to rely on any single financial measure to evaluate the Company . Non - GAAP financial measures have inherent limitations, are not uniformly applied and are not audited . Because non - GAAP financial measures are not standardized, it may not be possible to compare these financial measures with other companies’ non - GAAP financial measures having the same or similar names . The delivery of this Investor Presentation will not, under any circumstances, create an implication that there has been no change in the affairs of the Company since the date of this Investor Presentation . The Company is not making any implied or express representation or warranty as to the accuracy or completeness of the information summarized herein or made available in connection with any further investigation of the Company . The Company expressly disclaims any and all liability which may be based on such information, errors therein or omissions therefrom . 2
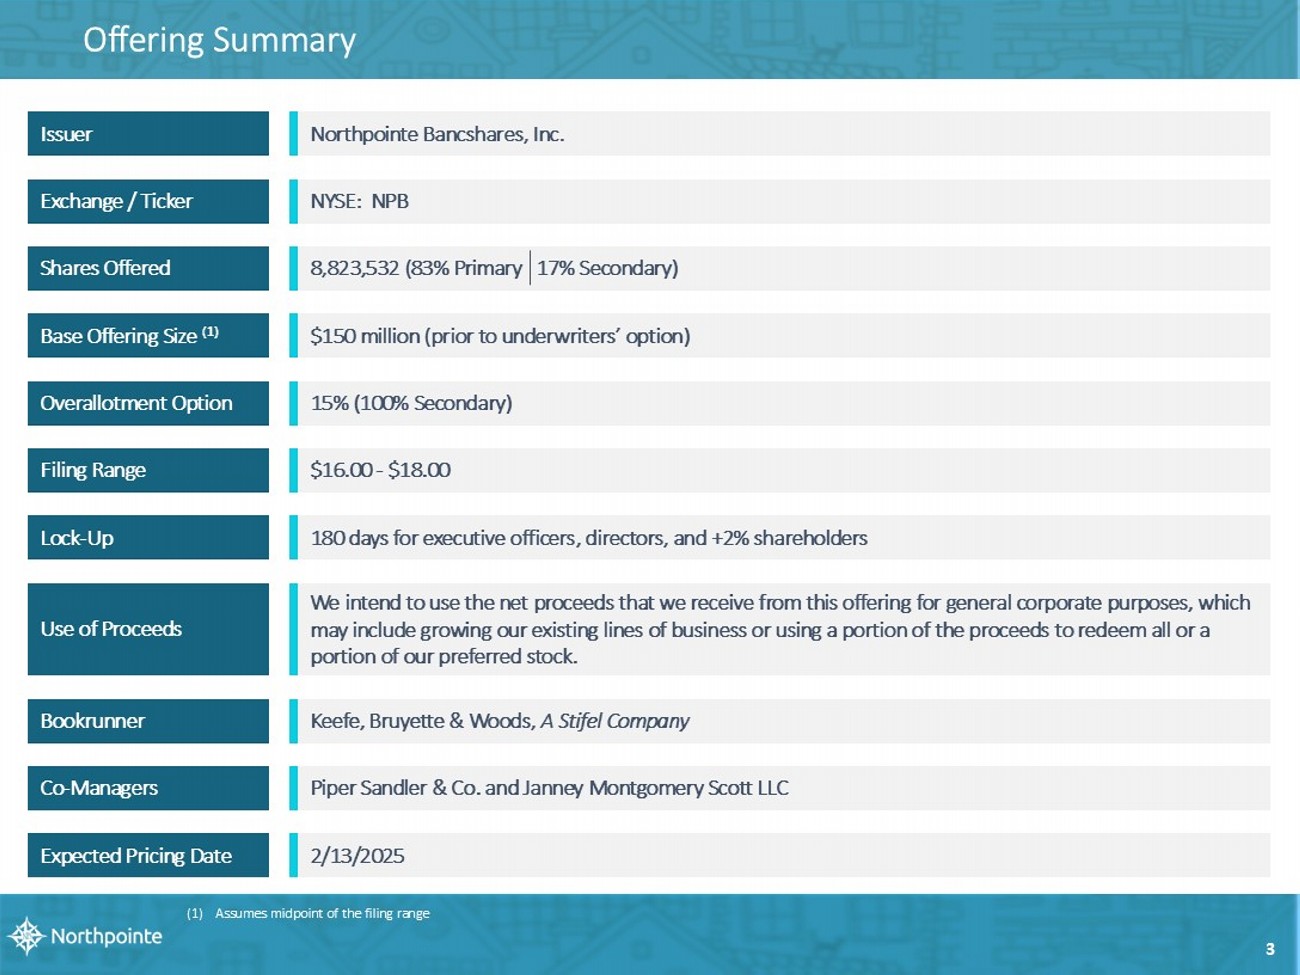
Offering Summary Expected Pricing Date Issuer Bookrunner Use of Proceeds Lock - Up Overallotment Option Base Offering Size (1) Exchange / Ticker Shares Offered 3 Co - Managers 2/13/2025 Northpointe Bancshares, Inc. Keefe, Bruyette & Woods, A Stifel Company We intend to use the net proceeds that we receive from this offering for general corporate purposes, which may include growing our existing lines of business or using a portion of the proceeds to redeem all or a portion of our preferred stock. 180 days for executive officers, directors, and +2% shareholders 15% (100% Secondary) $150 million (prior to underwriters’ option) NYSE: NPB 8,823,532 (83% Primary 17% Secondary) Piper Sandler & Co. and Janney Montgomery Scott LLC Filing Range $16.00 - $18.00 (1) Assumes midpoint of the filing range

Chuck A. Williams Chairman and CEO Kevin J. Comps President Bradley T. Howes Executive Vice President and CFO Mr . Williams is the Chairman, Chief Executive Officer, and director of the Company and is President, Chief Executive Officer, and director of our Bank . Mr . Williams has over 42 years of experience in the banking industry . Prior to becoming Chief Executive Officer of the Company and our Bank in 1998 , Mr . Williams served as a Senior Vice President, Senior Lending Officer, and Director of First National Bank of America (formerly named First National Bank of Michigan), where he was employed from 1988 through 1997 . His responsibilities included originating, negotiating, approving, and administering loans similar to those originated and made by our Bank . At First National Bank of America, Mr . Williams served on the executive committee of the board of directors and participated on all major senior management committees . Mr . Williams has a degree from the Graduate School of Banking at the University of Wisconsin . We believe that Mr . Williams’ knowledge of the Company, experience building and leading the Company, extensive banking experience in the Midwest, and his first - hand knowledge of our lines of business and corporate strategy provide our board of directors a valuable resource for understanding the day - to - day operations and strategic direction of the Company and the industry . Mr . Howes is the Executive Vice President and Chief Financial Officer of Northpointe Bancshares and our Bank . Since joining Northpointe Bancshares in 2023 , Mr . Howes has been responsible for overseeing the finance and accounting functions . From 2021 until 2023 , Mr . Howes was the Chief Financial Officer at West Shore Bank . Mr . Howes has over 23 years of experience in the financial services industry . That includes various senior finance roles including Director of Investor Relations, Senior Finance Manager of Financial Planning & Analysis and Chief Financial Officer . Prior to joining Northpointe Bancshares, Mr . Howes held leadership roles at Comerica Bank, Flagstar Bank, Umpqua Bank, TCF Bank and West Shore Bank . Mr . Howes has a Bachelor of Science degree in business administration from Central Michigan University and a Juris Doctorate from the University of Detroit Mercy School of Law . Mr . Comps is the President and Secretary of Northpointe Bancshares and our Bank . Mr . Comps joined our Bank in 2012 for three years and again in 2017 , and is responsible for overseeing Residential Lending, Deposit Banking, Loan Servicing, Information Technology, Compliance, Legal, Administration, Facilities, and Human Resources . Mr . Comps has over 20 years of experience in the financial services industry including various roles in executive management including Director of Finance and Accounting, Controller and Chief Financial Officer . Prior to joining Northpointe Bancshares, Mr . Comps held leadership roles at Capitol National Bank, Flagstar Bank, Michigan Commerce Bank, and Capitol Bancorp Limited . Mr . Comps has a Bachelor of Science degree in Business Administration from the Central Michigan University and also a degree from the Graduate School of Banking at the University of Wisconsin . Source: Company Documents 4 Presenters Today
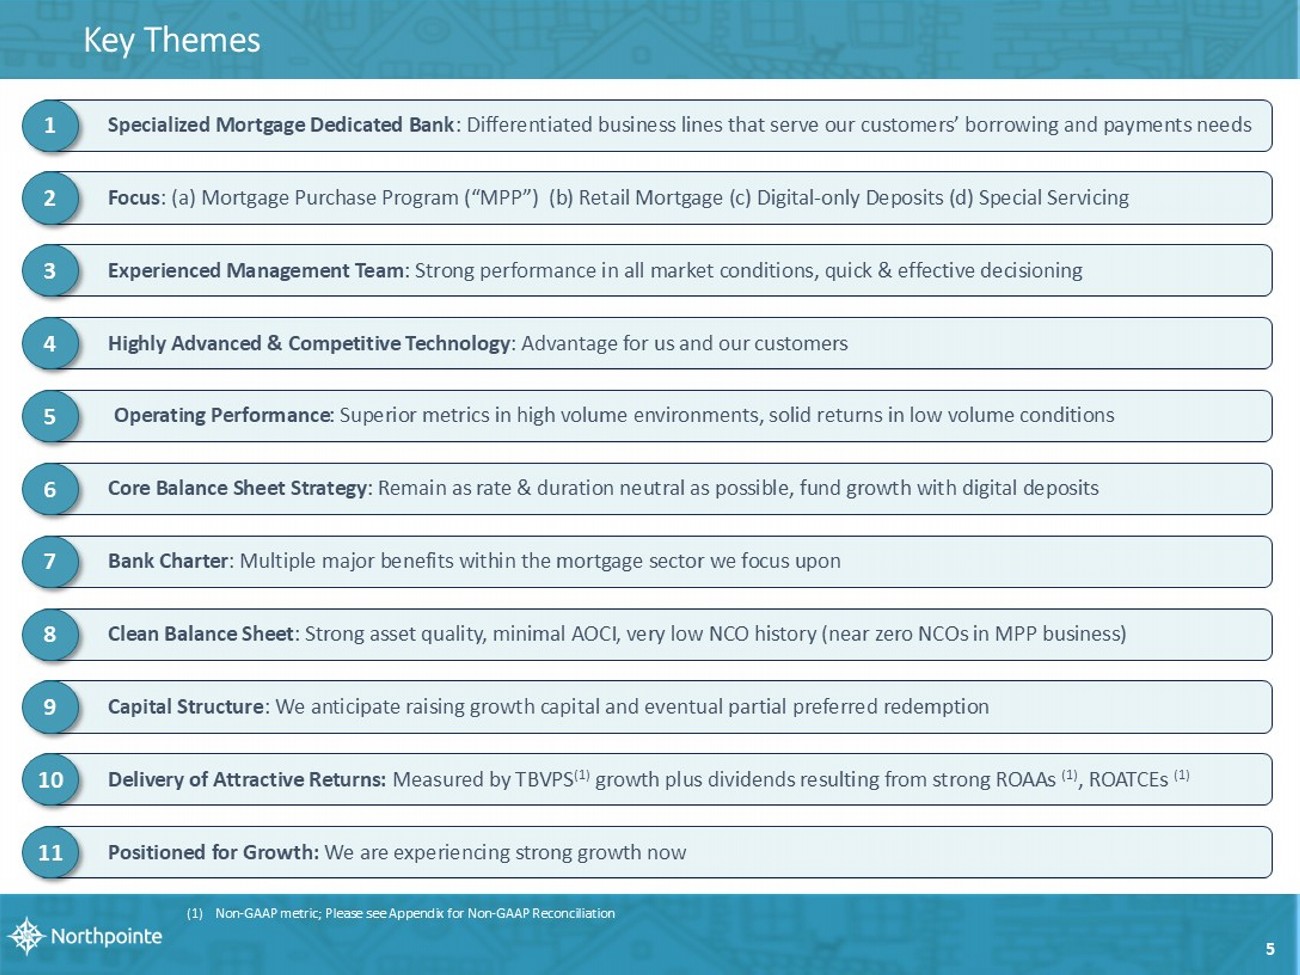
Key Themes Specialized Mortgage Dedicated Bank : Differentiated business lines that serve our customers’ borrowing and payments needs 1 Focus : (a) Mortgage Purchase Program (“MPP”) (b) Retail Mortgage (c) Digital - only Deposits (d) Special Servicing 2 Highly Advanced & Competitive Technology : A dvantage for us and our customers 4 Experienced Management Team : S trong performance in all market conditions, quick & effective decisioning 3 Delivery of Attractive Returns: M easured by TBVPS (1) growth plus dividends resulting from strong ROAAs (1) , ROATCEs (1) 10 Core Balance Sheet Strategy : R emain as r ate & duration neutral as possible, fund growth with digital deposits 6 Bank Charter : Multiple major benefits within the mortgage sector we focus upon 7 Capital Structure : W e anticipate raising growth capital and eventual partial preferred redemption 9 Operating Performance : Superior metrics in high volume environments, solid returns in low volume conditions 5 Positioned for Growth: W e are experiencing strong growth now 11 5 Clean Balance Sheet : Strong asset quality, minimal AOCI, very low NCO history (near zero NCOs in MPP business) 8 (1) Non - GAAP metric; Please see Appendix for Non - GAAP Reconciliation
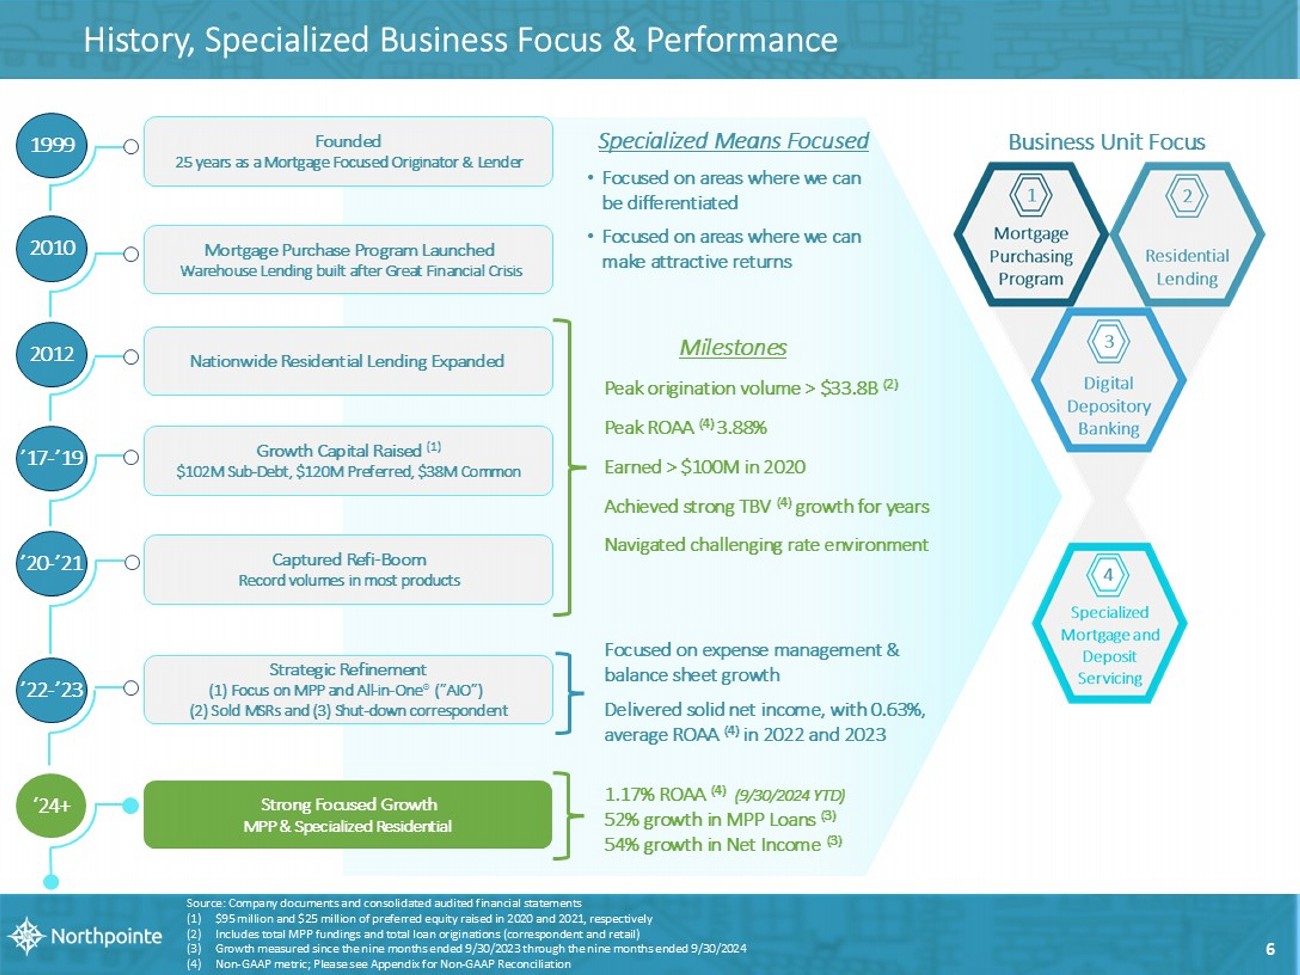
History, Specialized Business Focus & Performance 1999 2010 2012 ’17 - ’19 ’20 - ’21 ’22 - ’23 Founded 25 years as a Mortgage Focused Originator & Lender Mortgage Purchase Program Launched Warehouse Lending built after Great Financial Crisis Nationwide Residential Lending Expanded Growth Capital Raised (1) $102M Sub - Debt, $ 120 M Preferred, $38M Common Captured Refi - Boom Record volumes in most products Strategic Refinement (1) Focus on MPP and All - in - One ® (”AIO”) (2) S old MSRs and (3) S hut - down correspondent ‘24+ Strong Focused Growth MPP & Specialized Residential 6 Business Unit Focus Source: Company documents and consolidated audited financial statements (1) $95 million and $25 million of preferred equity raised in 2020 and 2021, respectively (2) Includes total MPP fundings and total loan originations (correspondent and retail) (3) Growth measured since the nine months ended 9/30/2023 through the nine months ended 9/30/2024 (4) Non - GAAP metric; Please see Appendix for Non - GAAP Reconciliation Peak origination volume > $33.8B (2) Peak ROAA (4) 3.88% Earned > $100M in 2020 Achieved strong TBV (4) growth for years Navigated challenging rate environment Specialized M eans Focused • Focused on areas where we can be differentiated • Focused on areas where we can make attractive returns Focused on expense management & balance sheet growth Delivered solid net income, with 0.63%, average ROAA (4) in 2022 and 2023 1.17% ROAA (4) (9/30/2024 YTD) 52% growth in MPP Loans (3) 54% growth in Net Income (3) Milestones
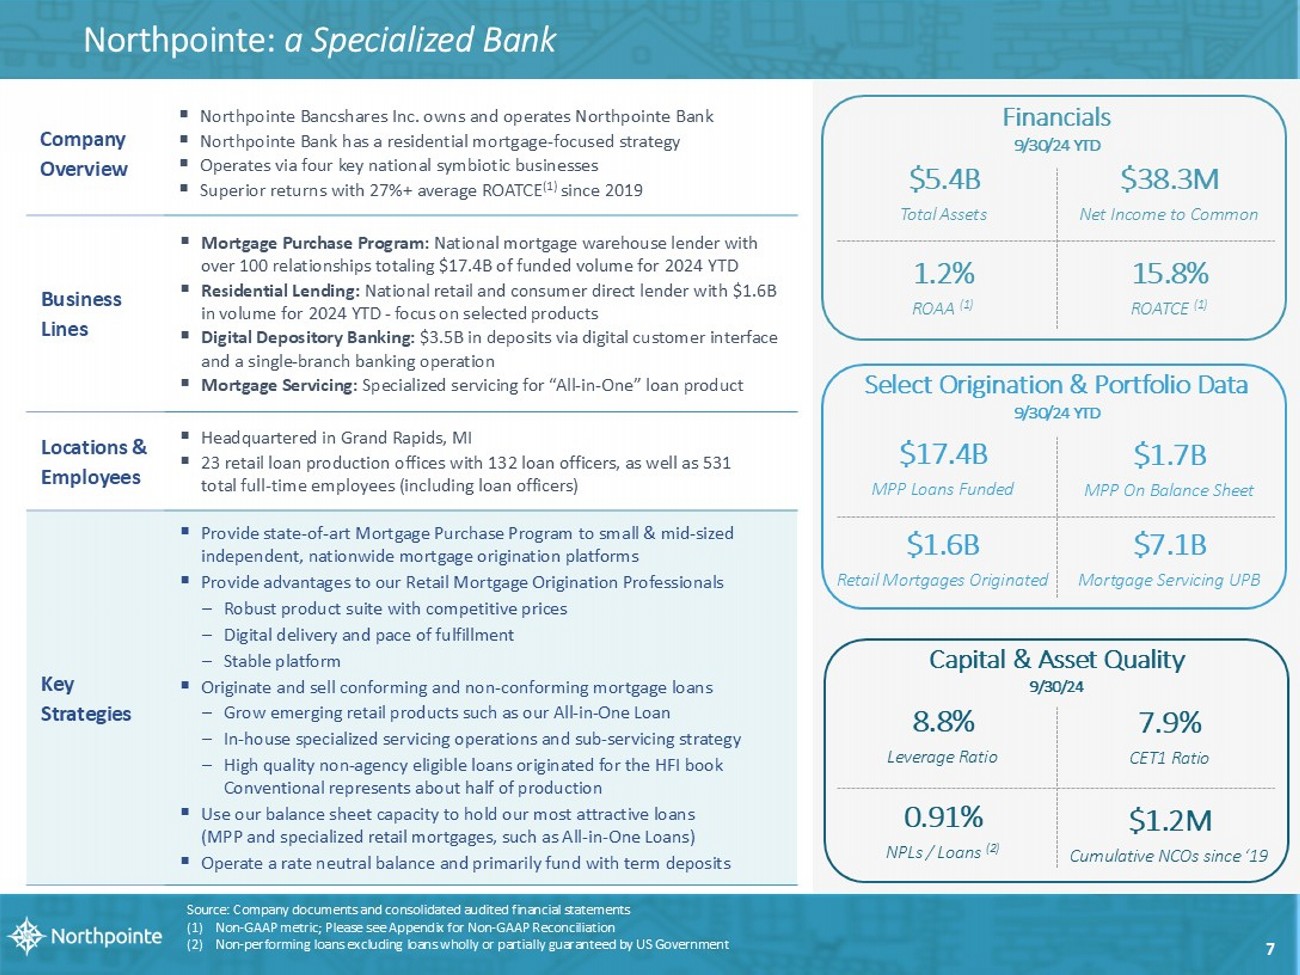
N orthpointe : a Specialized Bank ▪ Northpointe Bancshares Inc. owns and operates Northpointe Bank ▪ Northpointe Bank has a residential mortgage - focused strategy ▪ Operates via four key national symbiotic businesses ▪ Superior returns with 27%+ average ROATCE (1) since 2019 Company Overview ▪ Mortgage Purchase Program: N ational mortgage warehouse lender with over 100 relationships totaling $17.4B of funded volume for 2024 YTD ▪ Residential Lending: N ational retail and consumer direct lender with $1.6B in volume for 2024 YTD - focus on selected products ▪ Digital Depository Banking: $3.5B in deposits via digital customer interface and a s ingle - branch banking operation ▪ Mortgage Servicing: Specialized servicing for “All - in - One” loan product Bu si n ess Lines ▪ Headquartered in Grand Rapids, MI ▪ 23 retail loan production offices with 132 loan officers, as well as 531 total full - time employees (including loan officers) Locations & Employees ▪ Provide state - of - art Mortgage Purchase Program to small & mid - sized independent, nationwide mortgage origination platforms ▪ Provide advantages to our Retail Mortgage Origination Professionals – Robust product suite with competitive prices – Digital delivery and pace of fulfillment – Stable platform ▪ Originate and sell conforming and non - conforming mortgage loans – Grow emerging retail products such as our All - in - One Loan – In - house specialized servicing operations and sub - servicing strategy – High quality non - agency eligible loans originated for the HFI book Conventional represents about half of production ▪ Use our balance sheet capacity to hold our most attractive loans (MPP and specialized retail mortgages, such as All - in - One Loans) ▪ Operate a rate neutral balance and primarily fund with term deposits Key Strategies Financials 9/30/24 YTD 1.2 % ROAA (1) $ 5.4 B Total Assets $ 38.3 M Net Income to Common 15.8 % ROA TC E (1) Capital & Asset Quality 9/30/24 8.8 % Leverage Ratio 7.9 % CET1 Ratio 0.91 % NPLs / Loans (2) $1.2M Cumulative NCOs since ‘19 Source: Company documents and consolidated audited financial statements (1) Non - GAAP metric; Please see Appendix for Non - GAAP Reconciliation (2) Non - performing loans excluding loans wholly or partially guaranteed by US Government Select Origination & Portfolio Data 9/30/24 YTD $17.4B MPP Loans Funded $1.7B MPP On Balance Sheet $1.6B Retail Mortgages Originated $7.1B Mortgage Servicing UPB 7
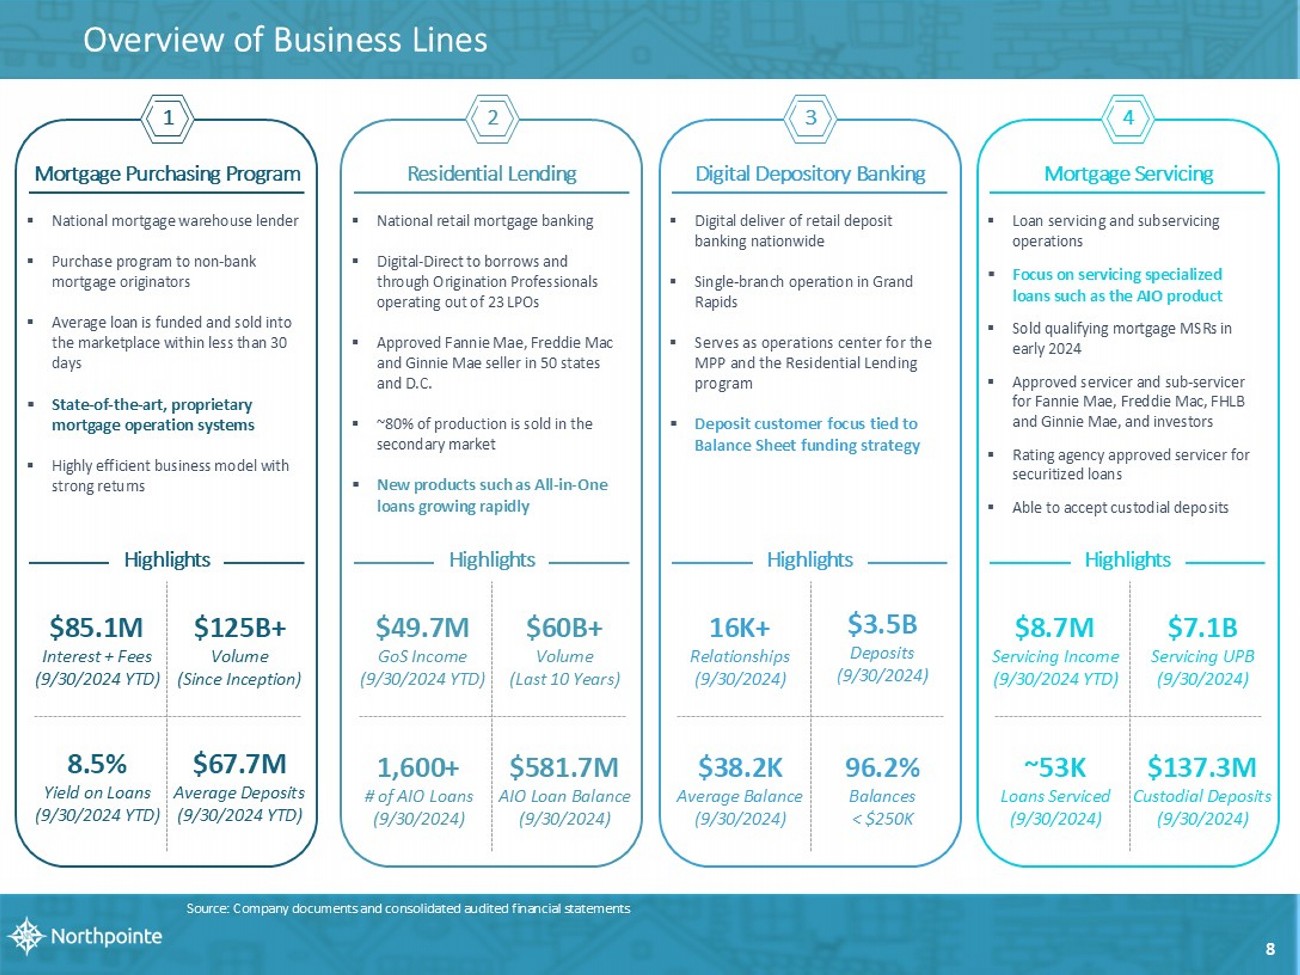
Source: Company documents and consolidated audited financial statem ents ▪ National mortgage warehouse lender ▪ Purchase program to non - bank mortgage originators ▪ Average loan is funded and sold into the marketplace within less than 30 days ▪ State - of - the - art, proprietary mortgage operation systems ▪ Highly efficient business model with strong returns Mortgage Purchasing Program Highlights $67. 7 M Average Deposits (9/30/2024 YTD) $85.1M Interest + Fees (9/30/2024 YTD) 8.5% Yield on Loans (9/30/2024 YTD) $125B+ Volume (Since Inception) ▪ National retail mortgage banking ▪ Digital - Direct to borrows and through Origination Professionals operating out of 23 LPOs ▪ Approved Fannie Mae, Freddie Mac and Ginnie Mae seller in 50 states and D.C. ▪ ~80% of production is sold in the secondary market ▪ New products such as All - in - One loans growing rapidly $49.7M GoS Income (9/30/2024 YTD) $60B+ Volume ( Last 10 Years) $581.7M AIO Loan Balance (9/30/2024) Residential Lending Highlights 1,600+ # of AIO Loans (9/30/2024) ▪ Loan servicing and subservicing operations ▪ Focus on servicing specialized loans such as the AIO product ▪ Sold qualifying mortgage MSRs in early 2024 ▪ Approved servicer and sub - servicer for Fannie Mae, Freddie Mac, FHLB and Ginnie Mae, and investors ▪ Rating agency approved servicer for securitized loans ▪ Able to accept custodial deposits $137.3M Custodial Deposits (9/30/2024) $7.1B Servicing UPB (9/30/2024) $8.7M Servicing Income (9/30/2024 YTD) Mortgage Servicing Highlights ▪ Digital deliver of retail deposit banking nationwide ▪ Single - branch operation in Grand Rapids ▪ Serves as operations center for the MPP and the Residential Lending program ▪ Deposit customer focus tied to Balance Sheet funding strategy $3.5B Deposits (9/30/2024) 16K+ Relationships (9/30/2024) Digital Depository Banking Highlights $38.2K Average Balance (9/30/2024) 96.2% Balances < $250K ~53K Loans Serviced (9/30/2024) 8 Overview of Business Lines 1 2 3 4
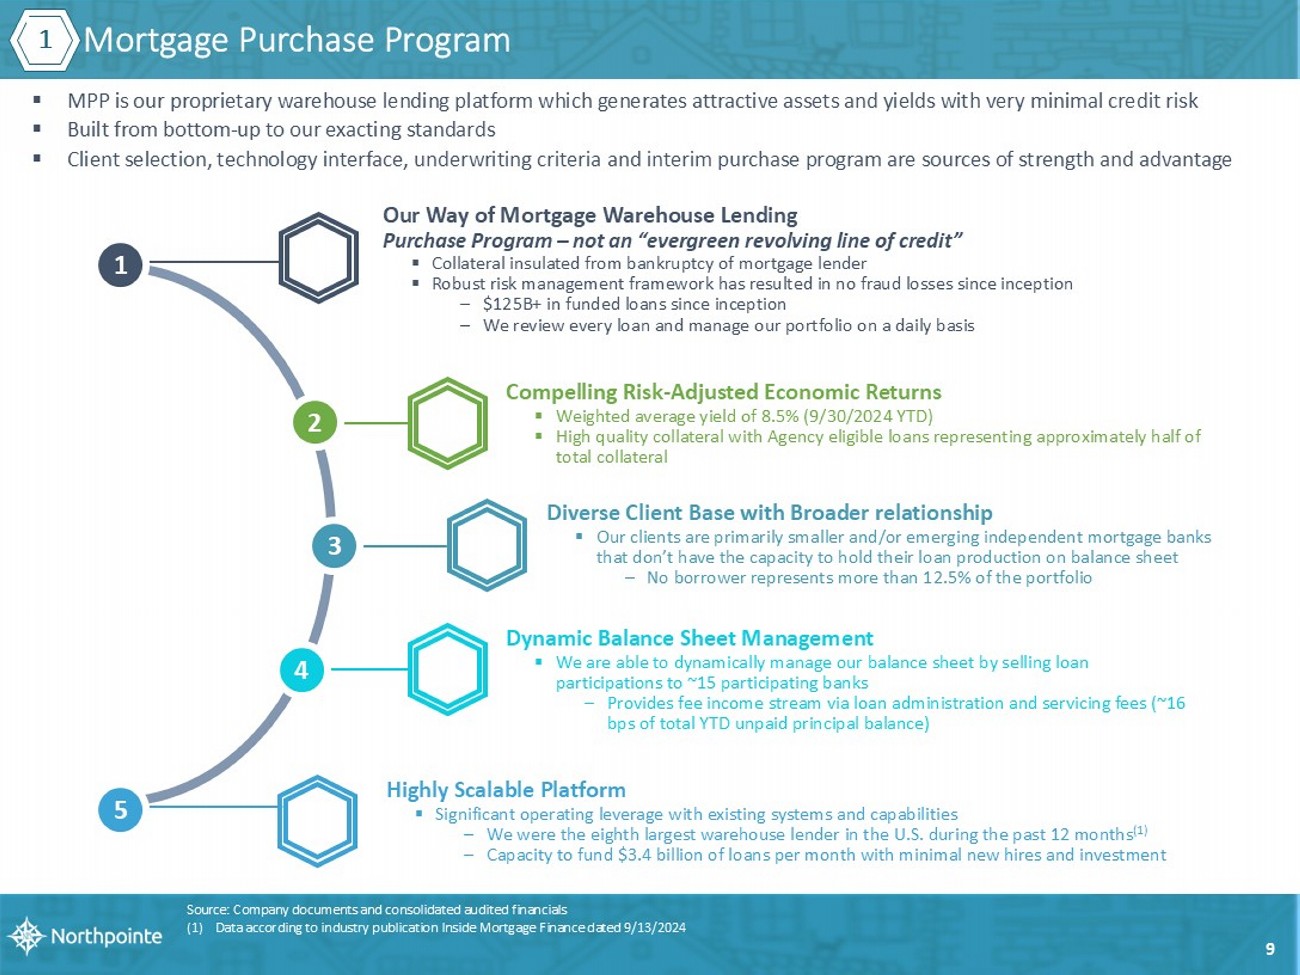
Mortgage Purchase Program ▪ MPP is our proprietary warehouse lending platform which generates attractive assets and yields with very minimal credit risk ▪ Built from bottom - up to our exacting standards ▪ Client selection, technology interface, underwriting criteria and interim purchase program are sources of strength and advantage 1 Our Way of Mortgage Warehouse Lending Purchase Program – not an “evergreen r evolving line of credit” ▪ Collateral insulated from bankruptcy of mortgage lender ▪ Robust risk management framework has resulted in no fraud losses since inception – $125B+ in funded loans since inception – We review every loan and manage our portfolio on a daily basis 3 Diverse Client Base with Broader relationship ▪ Our clients are primarily smaller and/or emerging independent mortgage banks that don’t have the capacity to hold their loan production on balance sheet – No borrower represents more than 12.5% of the portfolio 4 Dynamic Balance Sheet Management ▪ We are able to dynamically manage our balance sheet by selling loan participations to ~15 participating banks – Provides fee income stream via loan administration and servicing fees (~16 bps of total YTD unpaid principal balance ) 5 Highly Scalable Platform ▪ Significant operating leverage with existing systems and capabilities – We were the eighth largest warehouse lender in the U.S. during the past 12 months (1) – Capacity to fund $3.4 billion of loans per month with minimal new hires and investment 1 Source: Company documents and consolidated audited financials (1) Data according to industry publication Inside Mortgage Finance dated 9/13/2024 9 2 Compelling Risk - Adjusted Economic Returns ▪ Weighted average yield of 8.5% (9/30/2024 YTD) ▪ High quality collateral with Agency eligible loans representing approximately half of total collateral
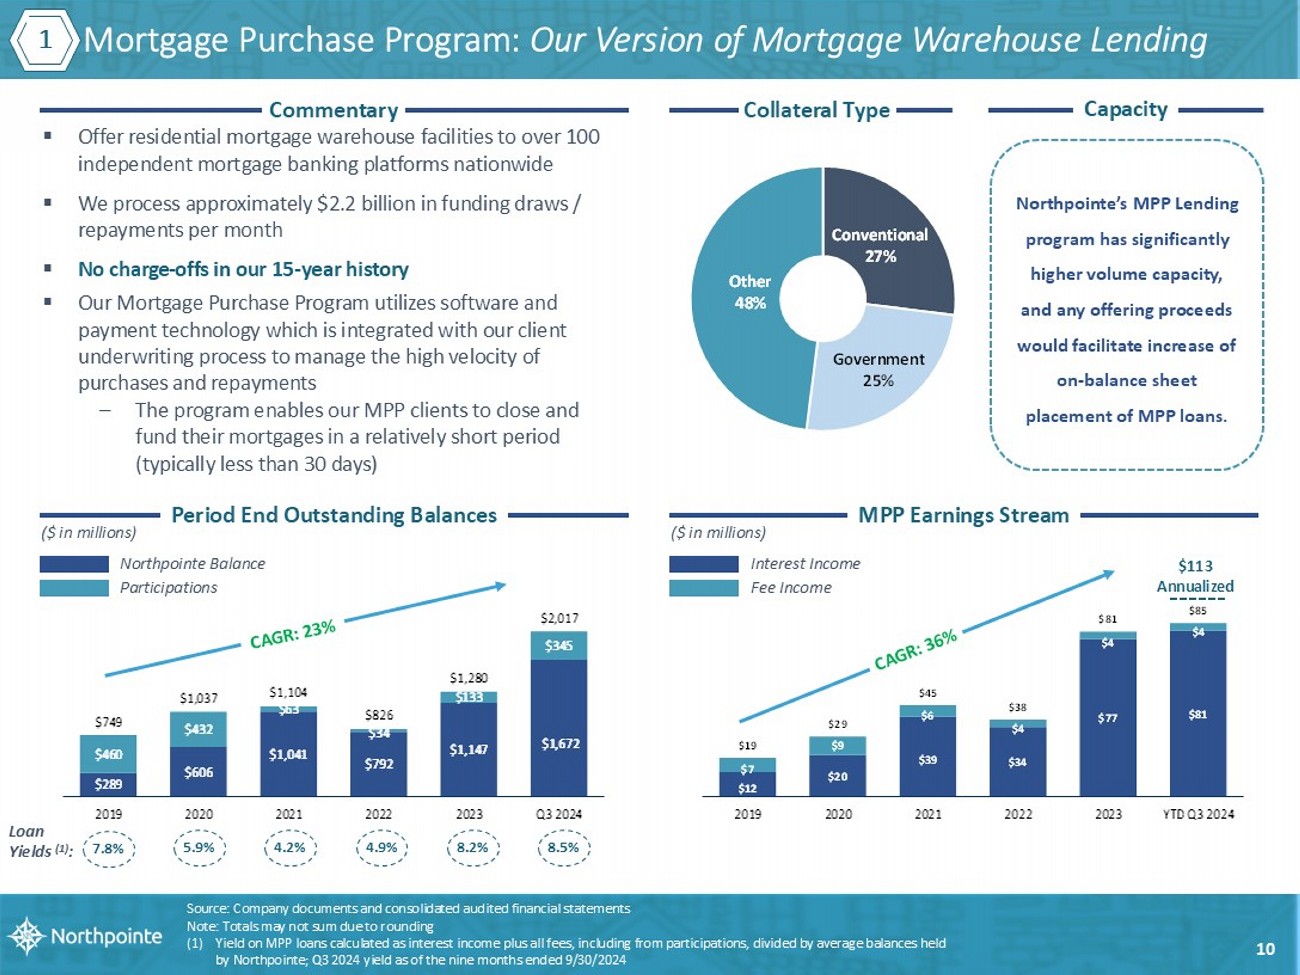
Collateral Type $289 $606 $1,041 $792 $1,147 $1,672 $460 $432 $63 $34 $133 $345 $749 $1,037 $1,104 $826 $1,280 $2,017 2019 2020 2021 2022 2023 Q3 2024 $12 $20 $39 $34 $77 $81 $7 $9 $6 $4 $4 $4 $19 $29 $45 $38 $81 $85 2019 2020 2021 2022 2023 YTD Q3 2024 Commentary Period End Outstanding Balances MPP Earnings Stream 7.8% 5.9% 4.2% 4.9% 8.2% 8.5% Loan Yields (1) : $113 Annualized ($ in millions) ($ in millions) Northpointe Balance Participations Interest Income Fee Income Mortgage Purchase Program: Our Version of Mortgage Warehouse Lending ▪ Offer residential mortgage warehouse facilities to over 100 independent mortgage banking platforms nationwide ▪ We process approximately $2.2 billion in funding draws / repayments per month ▪ No charge - offs in our 15 - year history ▪ Our Mortgage Purchase Program utilizes software and payment technology which is integrated with our client underwriting process to manage the high velocity of purchases and repayments – The program enables our MPP clients to close and fund their mortgages in a relatively short period (typically less than 30 days) Source: Company documents and consolidated audited financial statem ents Note: Totals may not sum due to rounding (1) Yield on MPP loans calculated as interest income plus all fees, including from participations, divided by average balances he ld by Northpointe; Q3 2024 yield as of the nine months ended 9/30/2024 Northpointe’s MPP Lending program has significantly higher volume capacity, and any offering proceeds would facilitate increase of on - balance sheet placement of MPP loans. Capacity 1 10 Conventional 27% Government 25% Other 48%
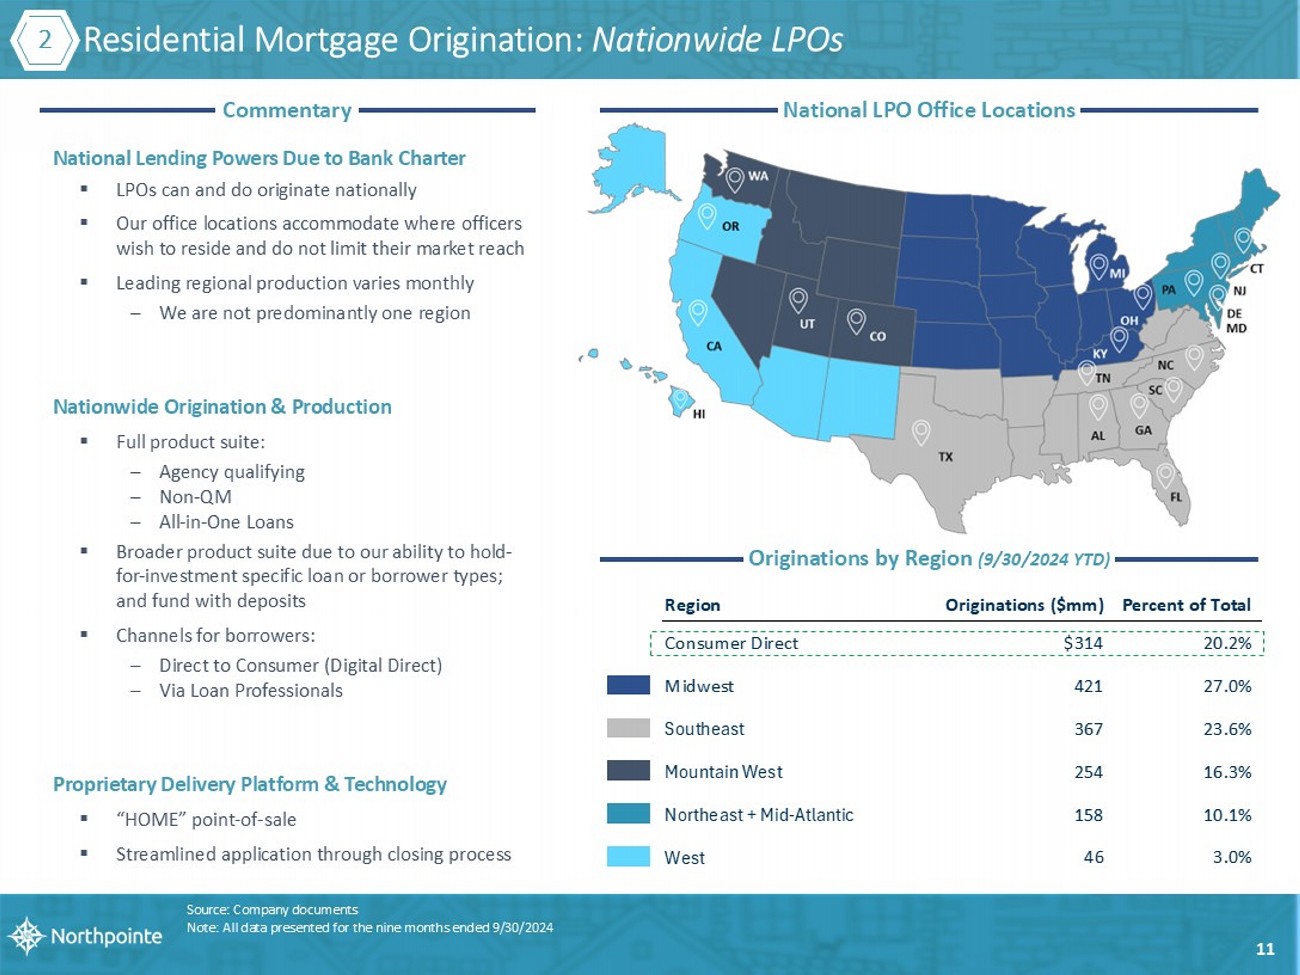
Residential Mortgage Origination: Nationwide LPOs Source: Company documents Note: All data presented for the nine months ended 9/30/2024 2 11 Commentary National Lending Powers Due to Bank Charter ▪ LPOs can and do originate nationally ▪ Our office locations accommodate where officers wish to reside and do not limit their market reach ▪ Leading regional production varies monthly – We are not predominantly one region Nationwide Origination & Production ▪ Full product suite: – Agency qualifying – Non - QM – All - in - One Loans ▪ Broader product suite due to our ability to hold - for - investment specific loan or borrower types; and fund with deposits ▪ Channels for borrowers: – Direct to Consumer (Digital Direct) – Via Loan Professionals Proprietary Delivery Platform & Technology ▪ “HOME” point - of - sale ▪ Streamlined application through closing process National LPO Office Locations Originations by Region (9/30/2024 YTD) Region Originations ($mm) Percent of Total Consumer Direct $314 20.2% Midwest 421 27.0% Southeast 367 23.6% Mountain West 254 16.3% Northeast + Mid-Atlantic 158 10.1% West 46 3.0%
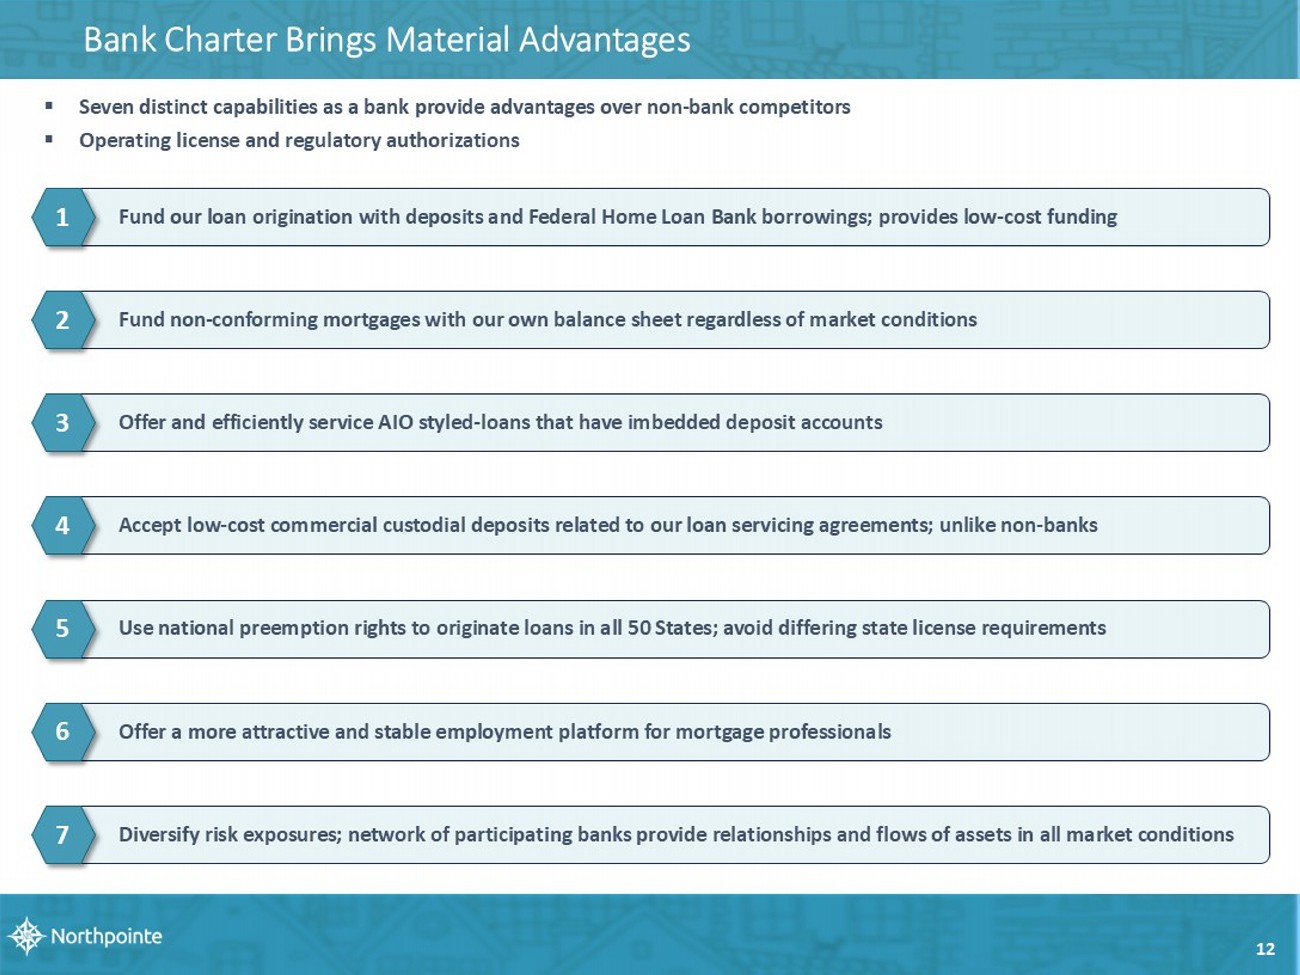
Diversify risk exposures; network of participating banks provide relationships and flows of assets in all market conditions Fund our loan origination with deposits and Federal Home Loan Bank borrowings; provides low - cost funding Fund non - conforming mortgages with our own balance sheet regardless of market conditions Offer and efficiently service AIO styled - loans that have imbedded deposit accounts Accept low - cost commercial custodial deposits related to our loan servicing agreements; unlike non - banks Use national preemption rights to originate loans in all 50 States; avoid differing state license requirements Offer a more attractive and stable employment platform for mortgage professionals 1 2 3 4 7 5 6 ▪ Seven distinct capabilities as a bank provide advantages over non - bank competitors ▪ Operating license and regulatory authorizations 12 Bank Charter Brings Material Advantages
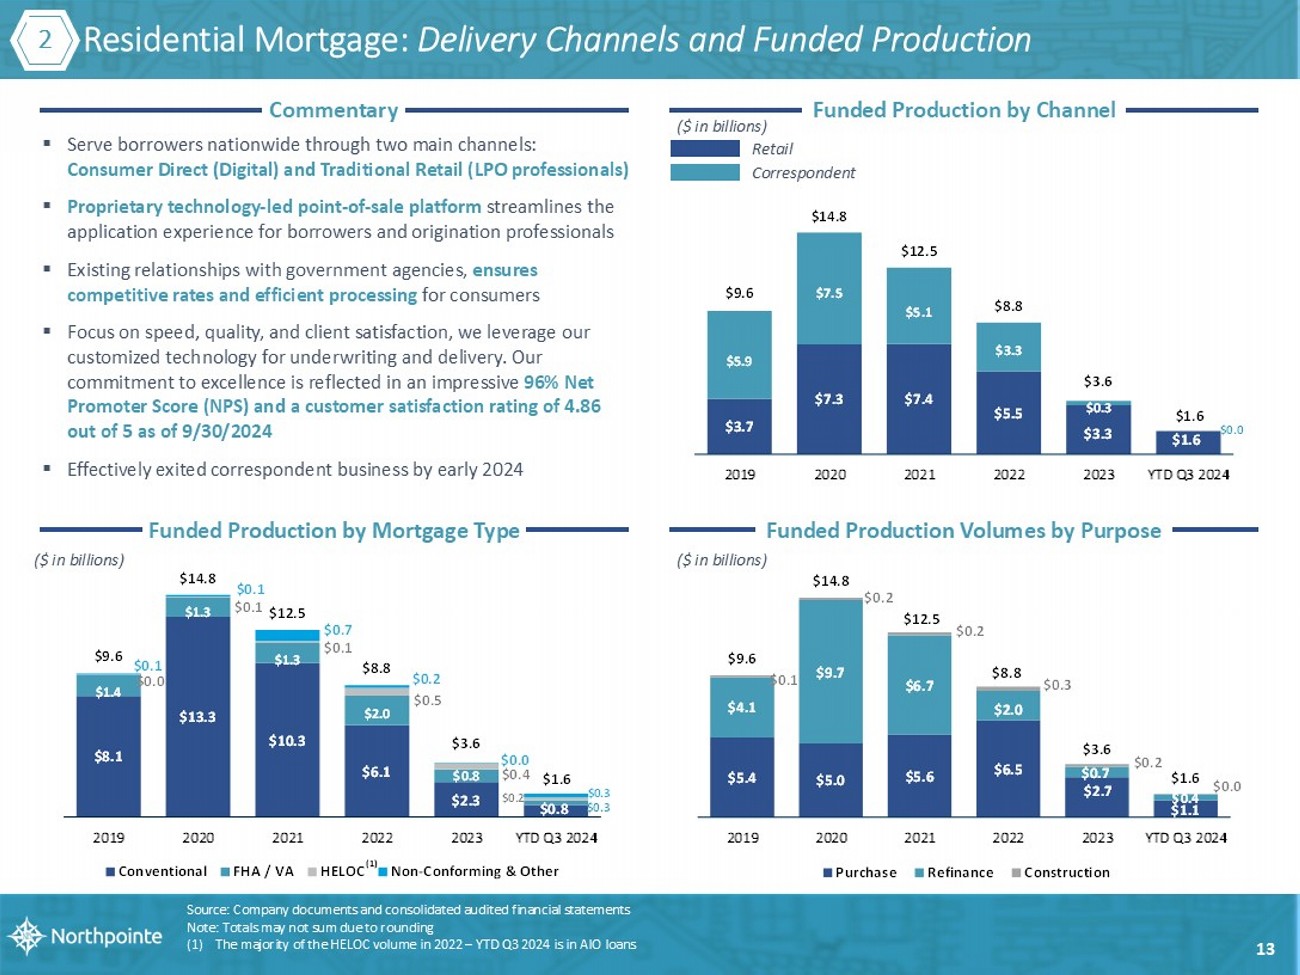
$3.7 $7.3 $7.4 $5.5 $3.3 $1.6 $5.9 $7.5 $5.1 $3.3 $0.3 $0.0 $9.6 $14.8 $12.5 $8.8 $3.6 $1.6 2019 2020 2021 2022 2023 YTD Q3 2024 Commentary Funded Production by Channel Funded Production by Mortgage Type Funded Production Volumes by Purpose ▪ Serve borrowers nationwide through two main channels: Consumer Direct (Digital) and Traditional Retail (LPO professionals) ▪ Proprietary technology - led point - of - sale platform streamlines the application experience for borrowers and origination professionals ▪ Existing relationships with government agencies, ensures competitive rates and efficient processing for consumers ▪ Focus on speed, quality, and client satisfaction, we leverage our customized technology for underwriting and delivery. Our commitment to excellence is reflected in an impressive 96% Net Promoter Score (NPS) and a customer satisfaction rating of 4.86 out of 5 as of 9/30/2024 ▪ Effectively exited correspondent business by early 2024 ($ in billions) ($ in billions) ($ in billions) Source: Company documents and consolidated audited financial statem ents Note: Totals may not sum due to rounding (1) The majority of the HELOC volume in 2022 – YTD Q3 2024 is in AIO loans Retail Correspondent Residential Mortgage: Delivery Channels and Funded Production 2 13 $5.4 $5.0 $5.6 $6.5 $2.7 $1.1 $4.1 $9.7 $6.7 $2.0 $0.7 $0.4 $0.1 $0.2 $0.2 $0.3 $0.2 $0.0 $9.6 $14.8 $12.5 $8.8 $3.6 $1.6 2019 2020 2021 2022 2023 YTD Q3 2024 Purchase Refinance Construction $8.1 $13.3 $10.3 $6.1 $2.3 $0.8 $1.4 $1.3 $1.3 $2.0 $0.8 $0.3 $0.0 $0.1 $0.1 $0.5 $0.4 $0.2 $0.1 $0.1 $0.7 $0.2 $0.0 $0.3 $9.6 $14.8 $12.5 $8.8 $3.6 $1.6 2019 2020 2021 2022 2023 YTD Q3 2024 Conventional FHA / VA HELOC Non-Conforming & Other (1)

Residential Lending Growth Product: All - in - One Loan Commentary ▪ One of our robustly growing products is the licensed and trade - marked All - in - One Loan (AIO) ▪ AIO combines the benefits of a revolving equity line of credit, a market rate cost of a first mortgage and sweep benefits of a d eposit account ▪ AIO has functionality of (1) a first mortgage plus (2) a revolving line of credit and ( 3) a deposit account allows borrower to: – Immediately access to their funds (the equity in their home, plus any net deposit balances) – S weep excess funds to paydown credit when funds are deposited or are not needed ▪ AIO customers empowered to use the account as their primary bank account because it has convenient features such as debit car d, direct deposit acceptance and bill - payment services ▪ Our borrowers choose the AIO product for such reasons as it allows them to: – Pay off the mortgage more quickly and easily – Lowers a borrower’s lifetime cost of a mortgage considerably – Accommodate non - traditional income payment schedules (i.e. non - bi - monthly paydays, gig - economy employees, etc.) – Consolidate total household debt more economically – Navigate retirement finances more easily Period End Outstanding Balance AIO Revenue Stream $2 $3 $3 $12 $36 $34 $1 $2 $2 $3 $3 $12 $37 $36 2019 2020 2021 2022 2023 YTD Q3 2024 ($ in millions) Interest Income Fee Income ($ in millions) $28 $81 $92 $323 $506 $582 2019 2020 2021 2022 2023 Q3 2024 $49 Annualized Source: Company documents and consolidated audited financial statements 2 14

Digital Deposit Platform ($ in millions) Source: Company documents and consolidated audited financial statements Note: Totals may not sum due to rounding (1) Cost of total deposits calculated as interest expense on deposits divided by average deposit balances held by Northpointe; Q3 2024 cost of deposits as of the nine months ended 9/30/2024 Q3 2024 Deposit Composition Period End Outstanding Balances Commentary $1,124 $1,294 $2,596 $2,579 $2,672 $3,310 $193 $363 $340 $343 $253 $222 $1,317 $1,657 $2,935 $2,921 $2,926 $3,532 2019 2020 2021 2022 2023 Q3 2024 2.08% 1.51% 0.60% 1.50% 4.13% 4.70% Cost of Deposits (1) : Interest - bearing Noninterest - bearing ▪ Digital Deposit Banking – a core strategy ▪ Provides competitive funding advantages: – Reliable and speedy source of significant liquidity coming directly from consumers and deposit brokers – Sourced nationwide rather than from narrow geography or branch - based footprint – More flexible and lower all - in - cost of funding than a traditional, branch - based retail deposits – Average retail balances of about $38,000 and 96.2% have dollar balances under $250,000 ▪ Sourced in amounts to satisfy daily, weekly, monthly and quarterly funding needs given loan production pipelines ▪ Digital - only focus uniquely allows contemporary without “bleeding edge” downside 3 15 74% 6% 11% 9% Time Deposits Non-Interest Bearing MMDA & Savings Other Transaction Accounts 88% 12% Brokered Retail & Other Total Deposits Time Deposits $3.5B $2.6B
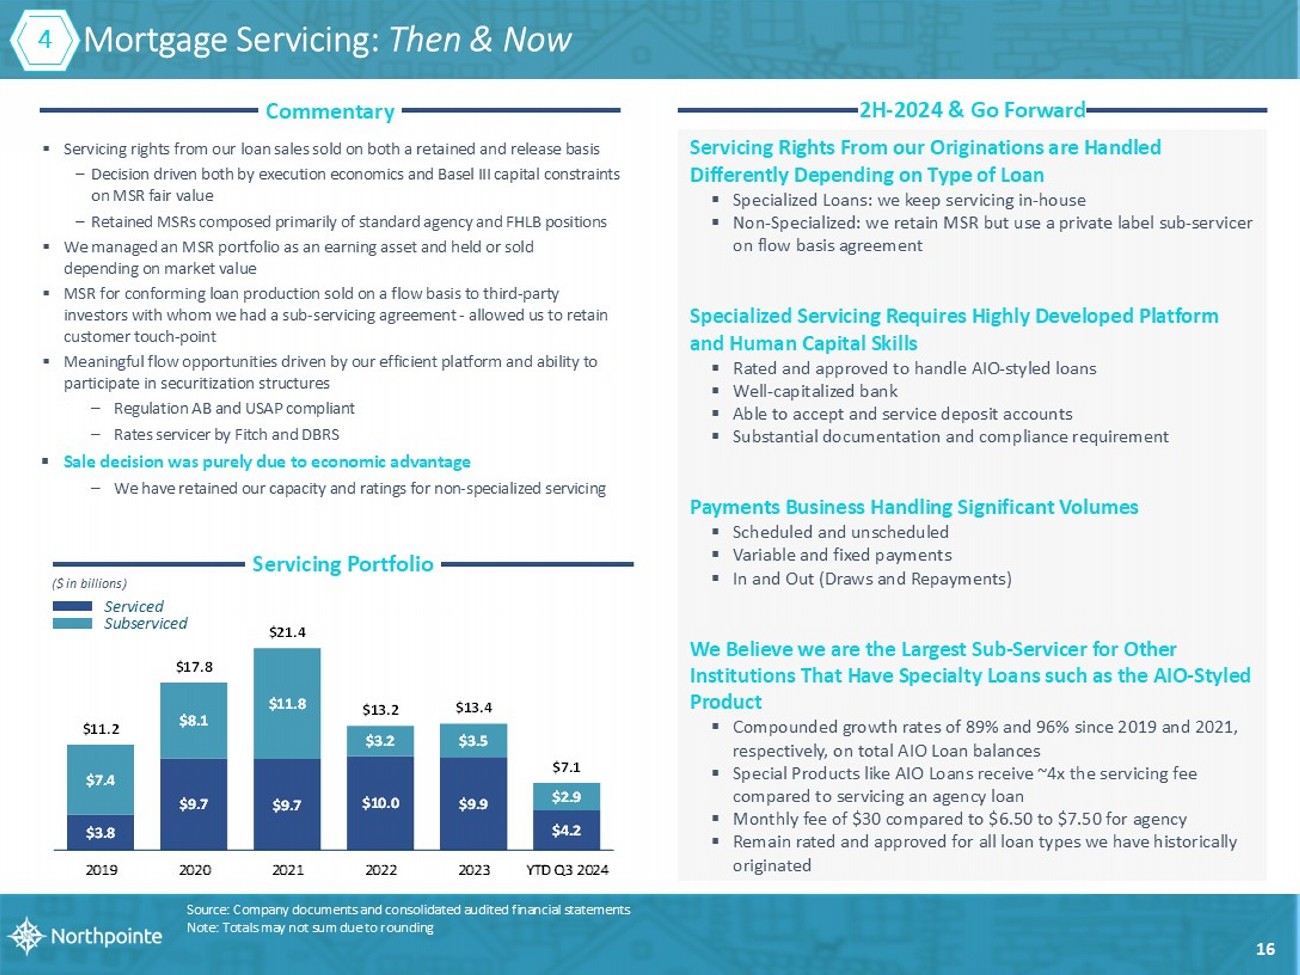
$3.8 $9.7 $9.7 $10.0 $9.9 $4.2 $7.4 $8.1 $11.8 $3.2 $3.5 $2.9 $11.2 $17.8 $21.4 $13.2 $13.4 $7.1 2019 2020 2021 2022 2023 YTD Q3 2024 Servicing Rights From our Originations are Handled Differently Depending on Type of Loan ▪ Specialized Loans: we keep servicing in - house ▪ Non - Specialized: we retain MSR but use a private label sub - servicer on flow basis agreement Specialized Servicing Requires Highly Developed Platform and Human Capital Skills ▪ Rated and approved to handle AIO - styled loans ▪ Well - capitalized bank ▪ Able to accept and service deposit accounts ▪ Substantial documentation and compliance requirement Payments Business Handling Significant Volumes ▪ Scheduled and unscheduled ▪ Variable and fixed payments ▪ In and Out (Draws and Repayments) We Believe we are the Largest Sub - Servicer for Other Institutions That Have Specialty Loans such as the AIO - Styled Product ▪ Compounded growth rates of 89% and 96% since 2019 and 2021, respectively, on total AIO Loan balances ▪ Special Products like AIO Loans receive ~4x the servicing fee compared to servicing an agency loan ▪ Monthly fee of $30 compared to $6.50 to $7.50 for agency ▪ Remain rated and approved for all loan types we have historically originated ▪ Servicing rights from our loan sales sold on both a retained and release basis – Decision driven both by execution economics and Basel III capital constraints on MSR fair value – Retained MSRs composed primarily of standard agency and FHLB positions ▪ We managed an MSR portfolio as an earning asset and held or sold depending on market value ▪ MSR for conforming loan production sold on a flow basis to third - party investors with whom we had a sub - servicing agreement - allowed us to retain customer touch - point ▪ Meaningful flow opportunities driven by our efficient platform and ability to participate in securitization structures – Regulation AB and USAP compliant – Rates servicer by Fitch and DBRS ▪ Sale decision was purely due to economic advantage – We have retained our capacity and ratings for non - specialized servicing Commentary 2H - 2024 & Go Forward Servicing Portfolio ($ in billions) Source: Company documents and consolidated audited financial statements Note: Totals may not sum due to rounding Serviced Subserviced 4 M ortgage Servicing: Then & Now 16
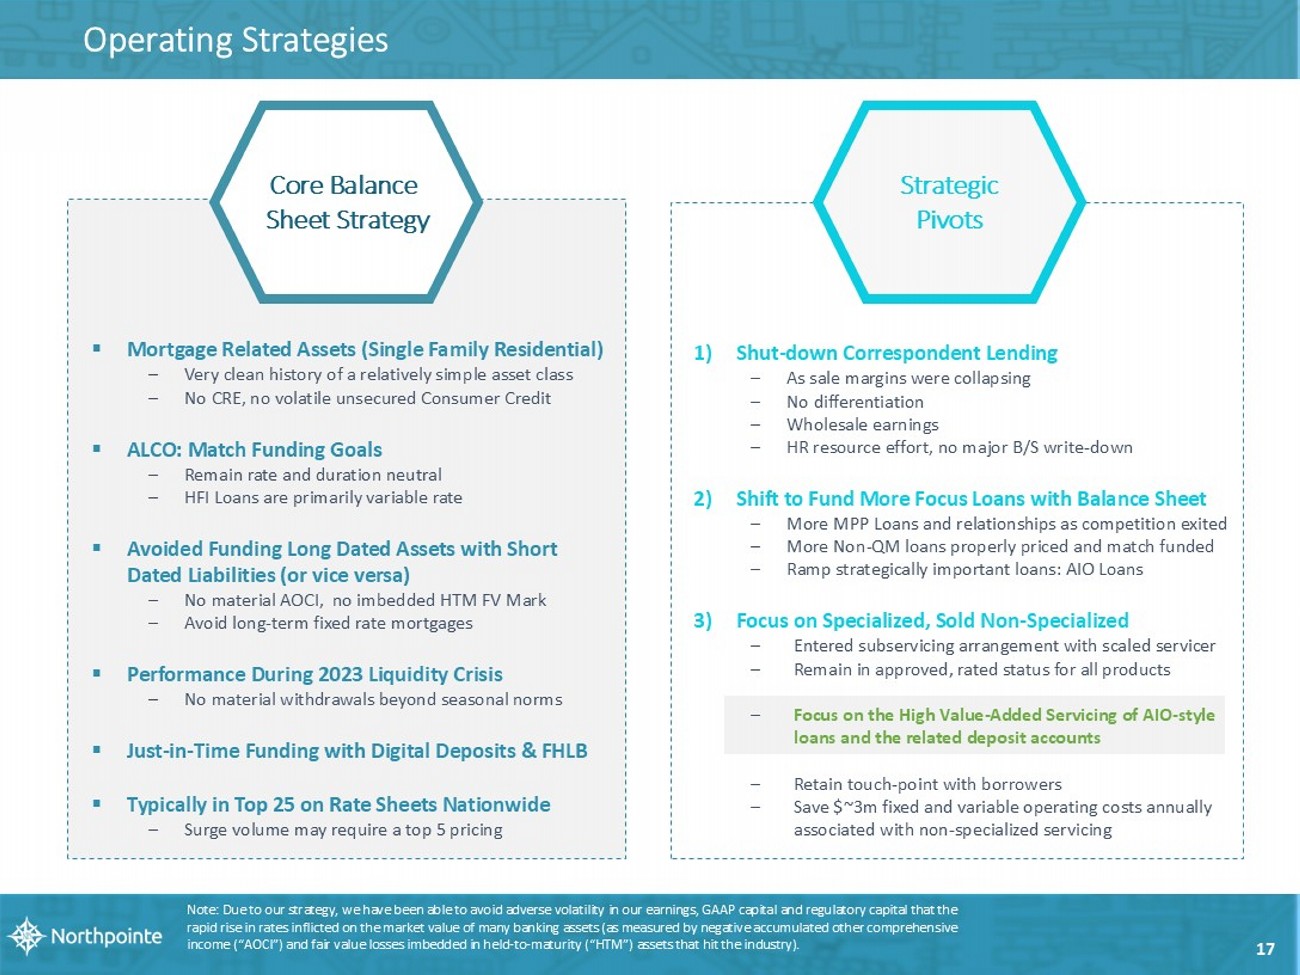
Operating Strategies ▪ Mortgage Related Assets (Single Family Residential) – Very clean history of a relatively simple asset class – No CRE, no volatile unsecured Consumer Credit ▪ ALCO: Match Funding Goals – Remain rate and duration neutral – HFI Loans are primarily variable rate ▪ Avoided Funding Long Dated Assets with Short Dated Liabilities (or vice versa) – No material AOCI, no imbedded HTM FV Mark – Avoid long - term fixed rate mortgages ▪ Performance During 2023 Liquidity Crisis – No material withdrawals beyond seasonal norms ▪ Just - in - Time Funding with Digital Deposits & FHLB ▪ Typically in Top 25 on Rate Sheets Nationwide – Surge volume may require a top 5 pricing Core Balance Sheet Strategy Note: Due to our strategy, we have been able to avoid adverse volatility in our earnings, GAAP capital and regulatory capital th at the rapid rise in rates inflicted on the market value of many banking assets (as measured by negative accumulated other comprehen siv e income (“AOCI”) and fair value losses imbedded in held - to - maturity (“HTM”) assets that hit the industry). 17 1) Shut - down Correspondent Lending – As sale margins were collapsing – No differentiation – Wholesale earnings – HR resource effort, no major B/S write - down 2) Shift to Fund More Focus Loans with Balance Sheet – More MPP Loans and relationships as competition exited – More Non - QM loans properly priced and match funded – Ramp strategically important loans: AIO Loans 3) Focus on Specialized, Sold Non - Specialized – Entered subservicing arrangement with scaled servicer – Remain in approved, rated status for all products – Focus on the High Value - Added Servicing of AIO - style loans and the related deposit accounts – Retain touch - point with borrowers – Save $~3m fixed and variable operating costs annually associated with non - specialized servicing Strategic Pivots
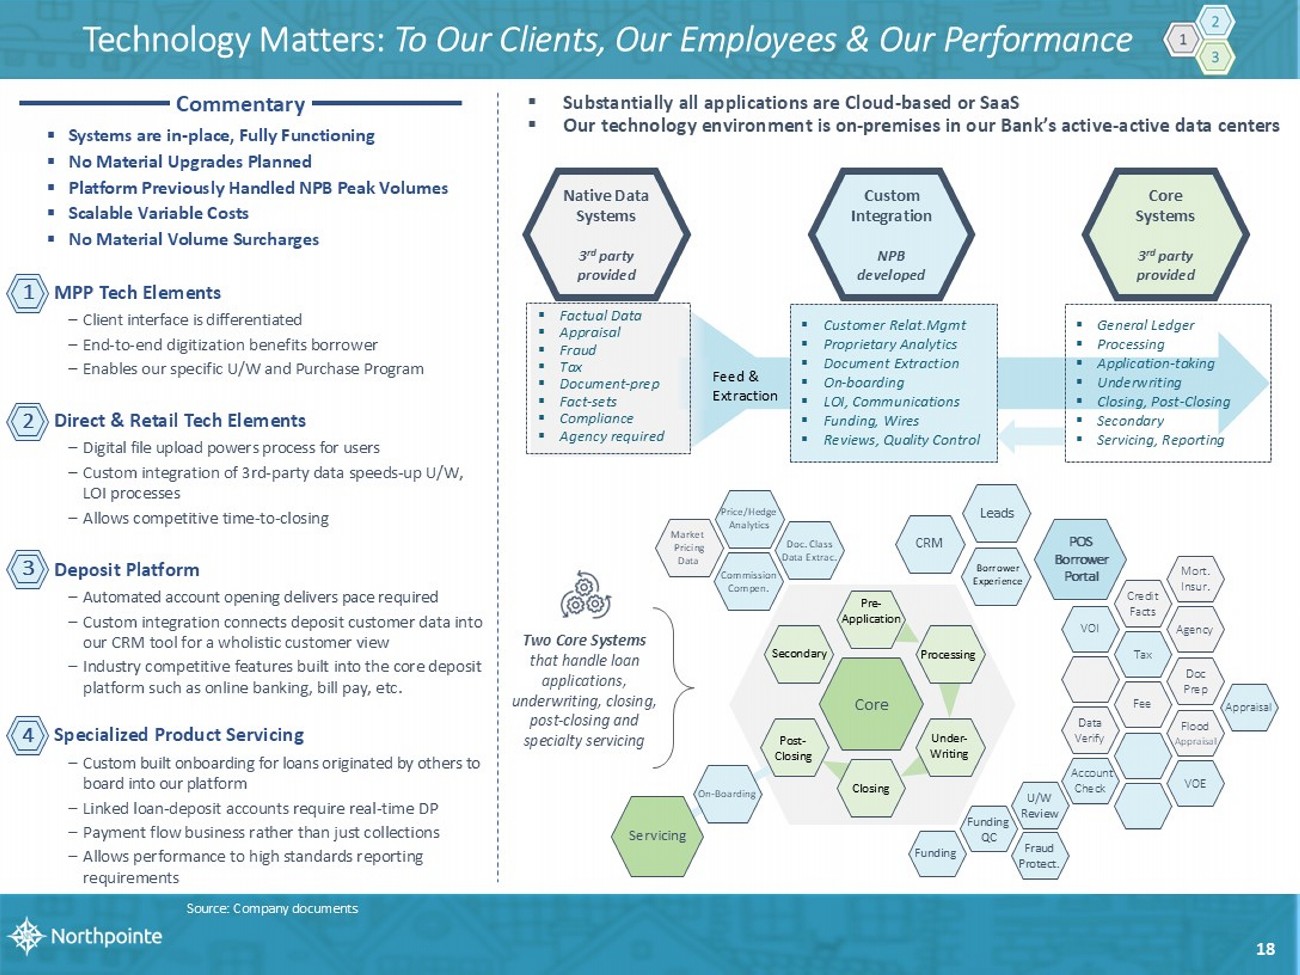
Technology Matters: To Our Clients, Our Employees & Our Performance Two Core Systems that handle loan applications, underwriting, closing, post - closing and specialty servicing ▪ Substantially all applications are Cloud - based or SaaS ▪ Our technology environment is on - premises in our Bank’s active - active data centers Servicing CRM Leads Borrower Experience POS Borrower Portal VOI Tax Fee Mort. Insur. Credit Facts Agency Doc Prep Flood Appraisal Appraisal VOE Account Check Data Verify Core Pre - Application Processing Under - Writing Closing Post - Closing Secondary U/W Review Fraud Protect. Funding QC Funding On - Boarding Commission Compen. Doc. Class Data Extrac. Price/Hedge Analytics Market Pricing Data Native Data Systems 3 rd party provided ▪ Factual Data ▪ Appraisal ▪ Fraud ▪ Tax ▪ Document - prep ▪ Fact - sets ▪ Compliance ▪ A gency required Custom Integration NPB developed ▪ Customer Relat.Mgmt ▪ Proprietary Analytics ▪ Document Extraction ▪ On - boarding ▪ LOI, Communications ▪ Funding, Wires ▪ Reviews, Qualit y Control Core Systems 3 rd party provided ▪ General Ledger ▪ Processing ▪ Application - taking ▪ Underwriting ▪ Closing, Post - Closing ▪ Secondary ▪ Servicing, Reporting Feed & Extraction ▪ Systems are in - place, Fully Functioning ▪ No Material Upgrades Planned ▪ Platform Previously Handled NPB Peak Volumes ▪ Scalable Variable Costs ▪ No Material Volume Surcharges MPP Tech Elements – Client interface is differentiated – End - to - end digitization benefits borrower – Enables our specific U/W and Purchase Program Direct & Retail Tech Elements – Digital file upload powers process for users – Custom integration of 3rd - party data speeds - up U/W, LOI processes – Allows competitive time - to - closing Deposit Platform – Automated account opening delivers pace required – Custom integration connects deposit customer data into our CRM tool for a wholistic customer view – Industry competitive features built into the core deposit platform such as online banking, bill pay, etc. Specialized Product Servicing – Custom built onboarding for loans originated by others to board into our platform – Linked loan - deposit accounts require real - time DP – Payment flow business rather than just collections – Allows performance to high standards reporting requirements 18 Commentary 1 2 3 4 Source: Company documents
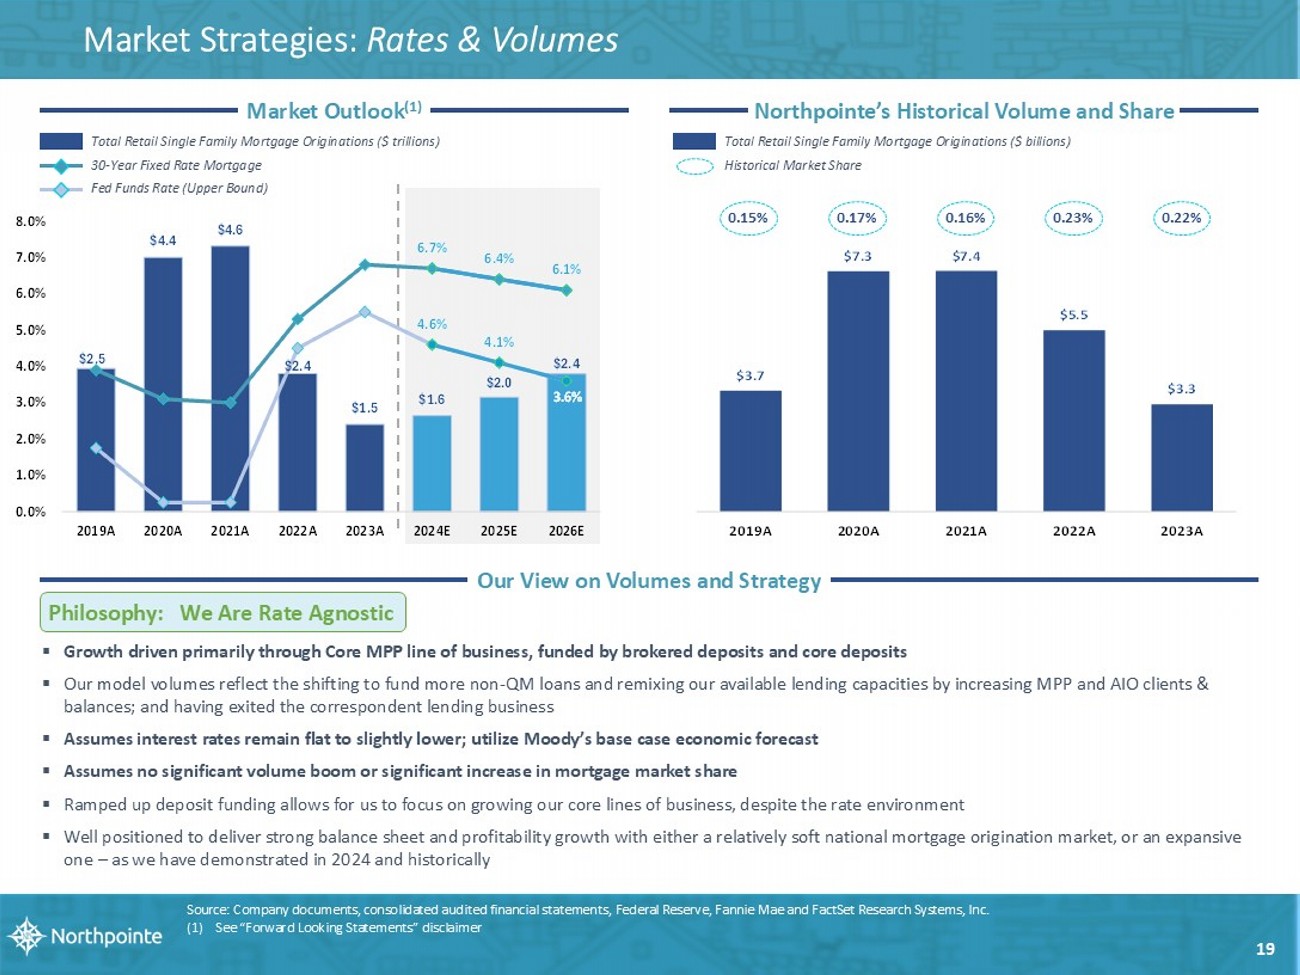
Our View on Volumes and Strategy Market Strategies: Rates & Volumes 19 Northpointe’s Historical Volume and Share Market Outlook (1) Source: Company documents, consolidated audited financial statements , Federal Reserve, Fannie Mae and FactSet Research Systems, Inc. (1) See “Forward Looking Statements” disclaimer Philosophy: We Are Rate Agnostic ▪ Growth driven primarily through Core MPP line of business, funded by brokered deposits and core deposits ▪ Our model volumes reflect the shifting to fund more non - QM loans and remixing our available lending capacities by increasing MPP and AIO clients & balances; and having exited the correspondent lending business ▪ Assumes interest rates remain flat to slightly lower; u tilize Moody’s base case economic forecast ▪ Assumes no significant volume boom or significant increase in mortgage market share ▪ Ramped up deposit funding allows for us to focus on growing our core lines of business, despite the rate environment ▪ Well positioned to deliver strong balance sheet and profitability growth with either a relatively soft national mortgage orig ina tion market, or an expansive one – as we have demonstrated in 2024 and historically $2.5 $4.4 $4.6 $2.4 $1.5 $1.6 $2.0 $2.4 4.6% 4.1% 3.6% 6.7% 6.4% 6.1% 0.0% 1.0% 2.0% 3.0% 4.0% 5.0% 6.0% 7.0% 8.0% 2019A 2020A 2021A 2022A 2023A 2024E 2025E 2026E Total Retail Single Family Mortgage Originations ($ trillions) 30 - Year Fixed Rate Mortgage Fed Funds Rate (Upper Bound) $3.7 $7.3 $7.4 $5.5 $3.3 2019A 2020A 2021A 2022A 2023A Total Retail Single Family Mortgage Originations ($ billions) Historical Market Share 0.15% 0.17% 0.16% 0.23% 0.22%
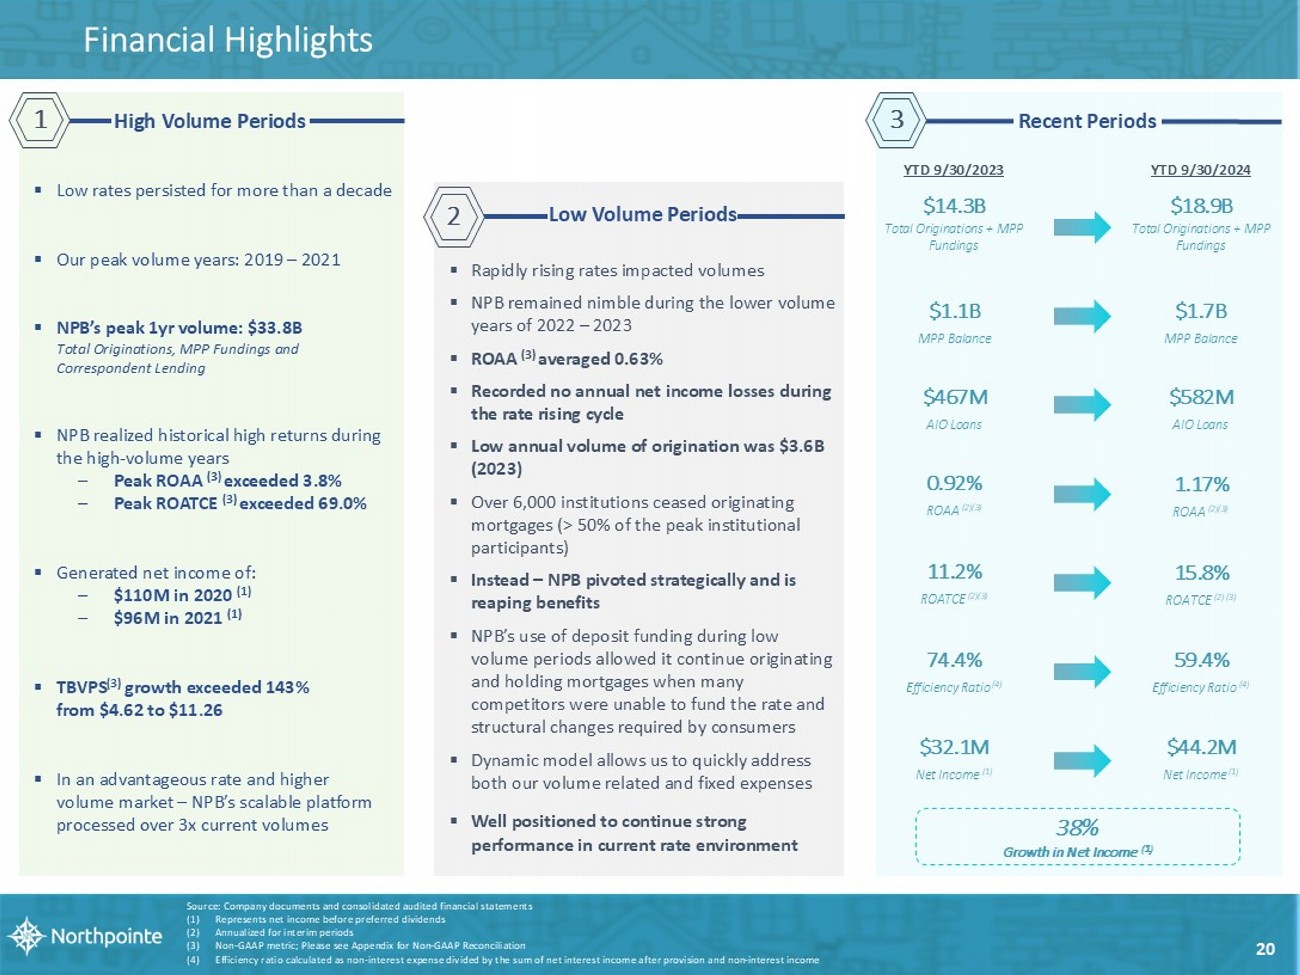
Financial Highlights $14.3B Total Originations + MPP Fundings $1.1B MPP Balance $467M AIO Loans 0.92 % ROAA (2)(3) 11.2 % ROA TC E (2)(3) 74.4 % Efficiency Ratio (4) $32.1M Net Income (1) YTD 9/30/2023 $18.9B Total Originations + MPP Fundings $1.7B MPP Balance $582M AIO Loans 1.17 % ROAA (2)(3) 15.8 % ROA TC E (2) (3) 59.4 % Efficiency Ratio (4) $44.2M Net Income (1) YTD 9/30/2024 Source: Company documents and consolidated audited financial statements (1) Represents net income before preferred dividends (2) Annualized for interim periods (3) Non - GAAP metric; Please see Appendix for Non - GAAP Reconciliation (4) Efficiency ratio calculated as non - interest expense divided by the sum of net interest income after provision and non - interest i ncome 38% Growth in Net Income (1) 20 High Volume Periods 1 Recent Periods 3 ▪ Low rates persisted for more than a decade ▪ Our peak volume years: 2019 – 2021 ▪ NPB’s peak 1yr volume: $33.8B Total Originations, MPP Fundings and Correspondent Lending ▪ NPB realized historical high returns during the high - volume years – Peak ROAA (3) exceeded 3.8% – Peak ROATCE (3) exceeded 69.0% ▪ Generated net income of: – $ 110M in 2020 (1) – $96M in 2021 (1) ▪ TBVPS (3) growth exceeded 143% from $4.62 to $11.26 ▪ In an advantageous rate and higher volume market – NPB’s scalable platform processed over 3x current volumes Low Volume Period s 2 ▪ Rapidly rising rates impacted volumes ▪ NPB remained nimble during the lower volume years of 2022 – 2023 ▪ ROAA (3) averaged 0.63% ▪ Recorded no annual net income losses during the rate rising cycle ▪ Low annual volume of origination was $3.6B (2023) ▪ Over 6,000 institutions ceased originating mortgages (> 50% of the peak institutional participants) ▪ Instead – NPB pivoted strategically and is reaping benefits ▪ NPB’s use of deposit funding during low volume periods allowed it continue originating and holding mortgages when many competitors were unable to fund the rate and structural changes required by consumers ▪ Dynamic model allows us to quickly address both our volume related and fixed expenses ▪ Well positioned to continue strong performance in current rate environment
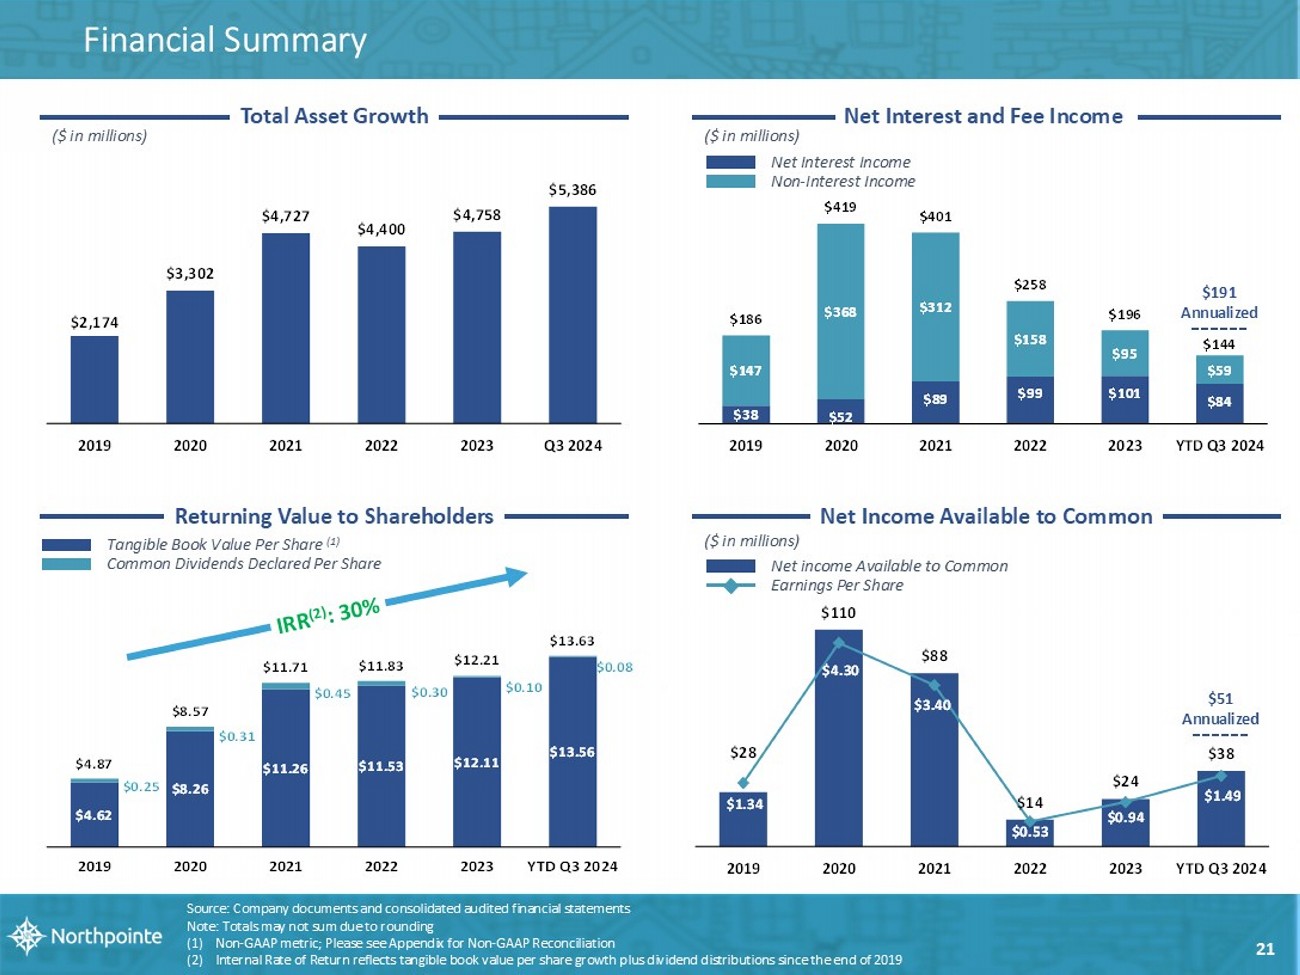
Source: Company documents and consolidated audited financial statements Note: Totals may not sum due to rounding (1) Non - GAAP metric; Please see Appendix for Non - GAAP Reconciliation (2) Internal Rate of Return reflects tangible book value per share growth plus dividend distributions since the end of 2019 Total Asset Growth ($ in millions) $2,174 $3,302 $4,727 $4,400 $4,758 $5,386 2019 2020 2021 2022 2023 Q3 2024 Returning Value to Shareholders Tangible Book Value Per Share (1) Common Dividends Declared Per Share Net Interest and Fee Income ($ in millions) $191 Annualized Net Interest Income Non - Interest Income $38 $52 $89 $99 $101 $84 $147 $368 $312 $158 $95 $59 $186 $419 $401 $258 $196 $144 2019 2020 2021 2022 2023 YTD Q3 2024 ($ in millions) $51 Annualized Net Income Available to Common 21 $4.62 $8.26 $11.26 $11.53 $12.11 $13.56 $0.25 $0.31 $0.45 $0.30 $0.10 $0.08 $4.87 $8.57 $11.71 $11.83 $12.21 $13.63 2019 2020 2021 2022 2023 YTD Q3 2024 $28 $110 $88 $14 $24 $38 $1.34 $4.30 $3.40 $0.53 $0.94 $1.49 $0.00 $0.50 $1.00 $1.50 $2.00 $2.50 $3.00 $3.50 $4.00 $4.50 $5.00 $0 $20 $40 $60 $80 $100 $120 2019 2020 2021 2022 2023 YTD Q3 2024 Net income Available to Common Earnings Per Share Financial Summary
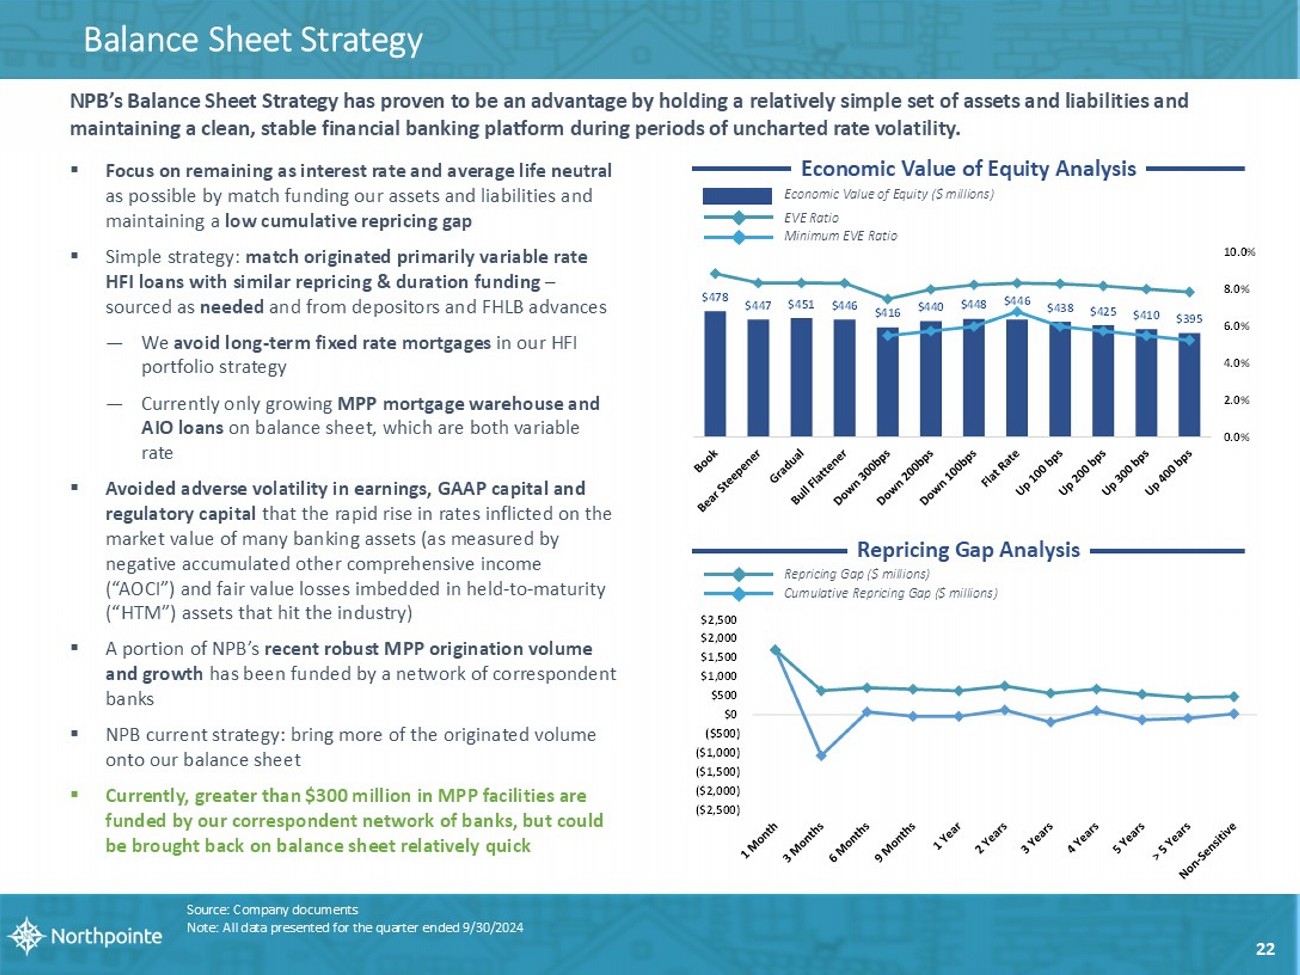
Balance Sheet Strategy Source: Company documents Note: All data presented for the quarter ended 9/30/2024 NPB’s Balance Sheet Strategy has proven to be an advantage by holding a relatively simple set of assets and liabilities and maintaining a clean, stable financial banking platform during periods of uncharted rate volatility. 22 ▪ Focus on remaining as interest rate and average life neutral as possible by match funding our assets and liabilities and maintaining a low cumulative repricing gap ▪ Simple strategy: match originated primarily variable rate HFI loans with similar repricing & duration funding – sourced as needed and from depositors and FHLB advances — We avoid long - term fixed rate mortgages in our HFI portfolio strategy — Currently only growing MPP mortgage warehouse and AIO loans on balance sheet, which are both variable rate ▪ Avoided adverse volatility in earnings, GAAP capital and regulatory capital that the rapid rise in rates inflicted on the market value of many banking assets (as measured by negative accumulated other comprehensive income (“AOCI”) and fair value losses imbedded in held - to - maturity (“HTM”) assets that hit the industry) ▪ A portion of NPB’s recent robust MPP origination volume and growth has been funded by a network of correspondent banks ▪ NPB current strategy: bring more of the originated volume onto our balance sheet ▪ Currently, greater than $300 million in MPP facilities are funded by our correspondent network of banks, but could be brought back on balance sheet relatively quick Economic Value of Equity Analysis Economic Value of Equity ($ millions) EVE Ratio Minimum EVE Ratio Repricing Gap Analysis Repricing Gap ($ millions) Cumulative Repricing Gap ($ millions) $478 $447 $451 $446 $416 $440 $448 $446 $438 $425 $410 $395 0.0% 2.0% 4.0% 6.0% 8.0% 10.0% ($2,500) ($2,000) ($1,500) ($1,000) ($500) $0 $500 $1,000 $1,500 $2,000 $2,500
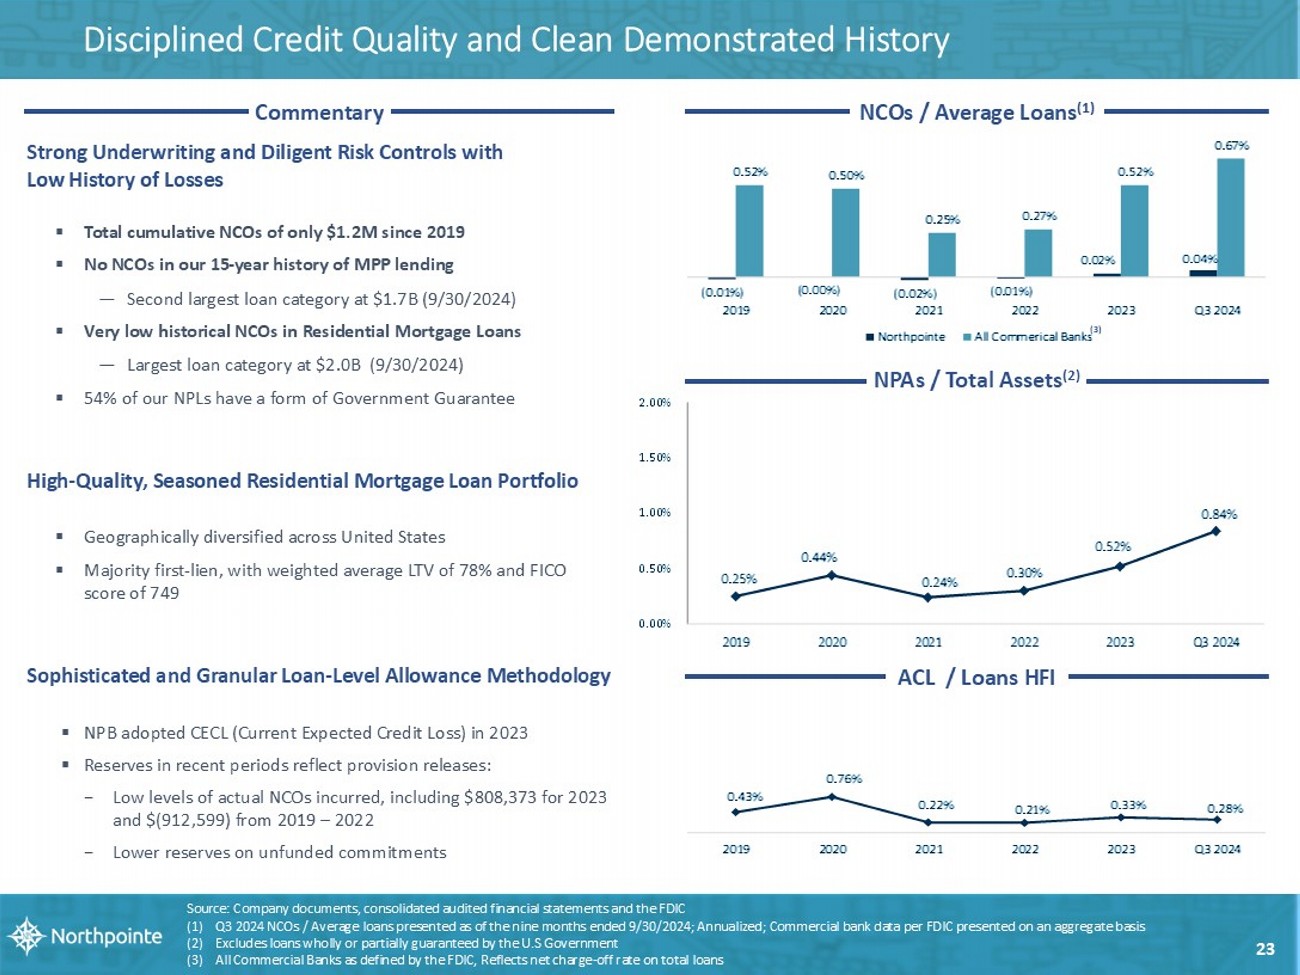
Source: Company documents, consolidated audited financial statements and the FDIC (1) Q3 2024 NCOs / Average loans presented as of the nine months ended 9/30/2024; Annualized; Commercial bank data per FDIC prese nte d on an aggregate basis (2) Excludes loans wholly or partially guaranteed by the U.S Government (3) All Commercial Banks as defined by the FDIC, Reflects net charge - off rate on total loans NPAs / Total Assets (2) ACL / Loans HFI 23 NCOs / Average Loans (1) (3) Commentary Strong Underwriting and Diligent R isk C ontrols with Low H istory of Losses ▪ Total cumulative NCOs of only $1.2M since 2019 ▪ No NCOs in our 15 - year history of MPP lending — Second largest loan category at $1.7B (9/30/2024) ▪ Very low historical NCOs in Residential Mortgage Loans — Largest loan category at $2.0B (9/30/2024) ▪ 54% of our NPLs have a form of Government Guarantee High - Quality, Seasoned Residential Mortgage Loan P ortfolio ▪ Geographically diversified across United States ▪ Majority first - lien, with weighted average LTV of 78% and FICO score of 749 Sophisticated and Granular L oan - Level A llowance M ethodology ▪ NPB adopted CECL (Current Expected Credit Loss) in 2023 ▪ Reserves in recent periods reflect provision releases: − Low levels of actual NCOs incurred, including $808,373 for 2023 and $(912,599) from 2019 – 2022 − Lower reserves on unfunded commitments D isciplined Credit Quality and Clean Demonstrated History (0.01%) (0.00%) (0.02%) (0.01%) 0.02% 0.04% 0.52% 0.50% 0.25% 0.27% 0.52% 0.67% 2019 2020 2021 2022 2023 Q3 2024 Northpointe All Commerical Banks 0.43% 0.76% 0.22% 0.21% 0.33% 0.28% 2019 2020 2021 2022 2023 Q3 2024 0.25% 0.44% 0.24% 0.30% 0.52% 0.84% 0.00% 0.50% 1.00% 1.50% 2.00% 2019 2020 2021 2022 2023 Q3 2024
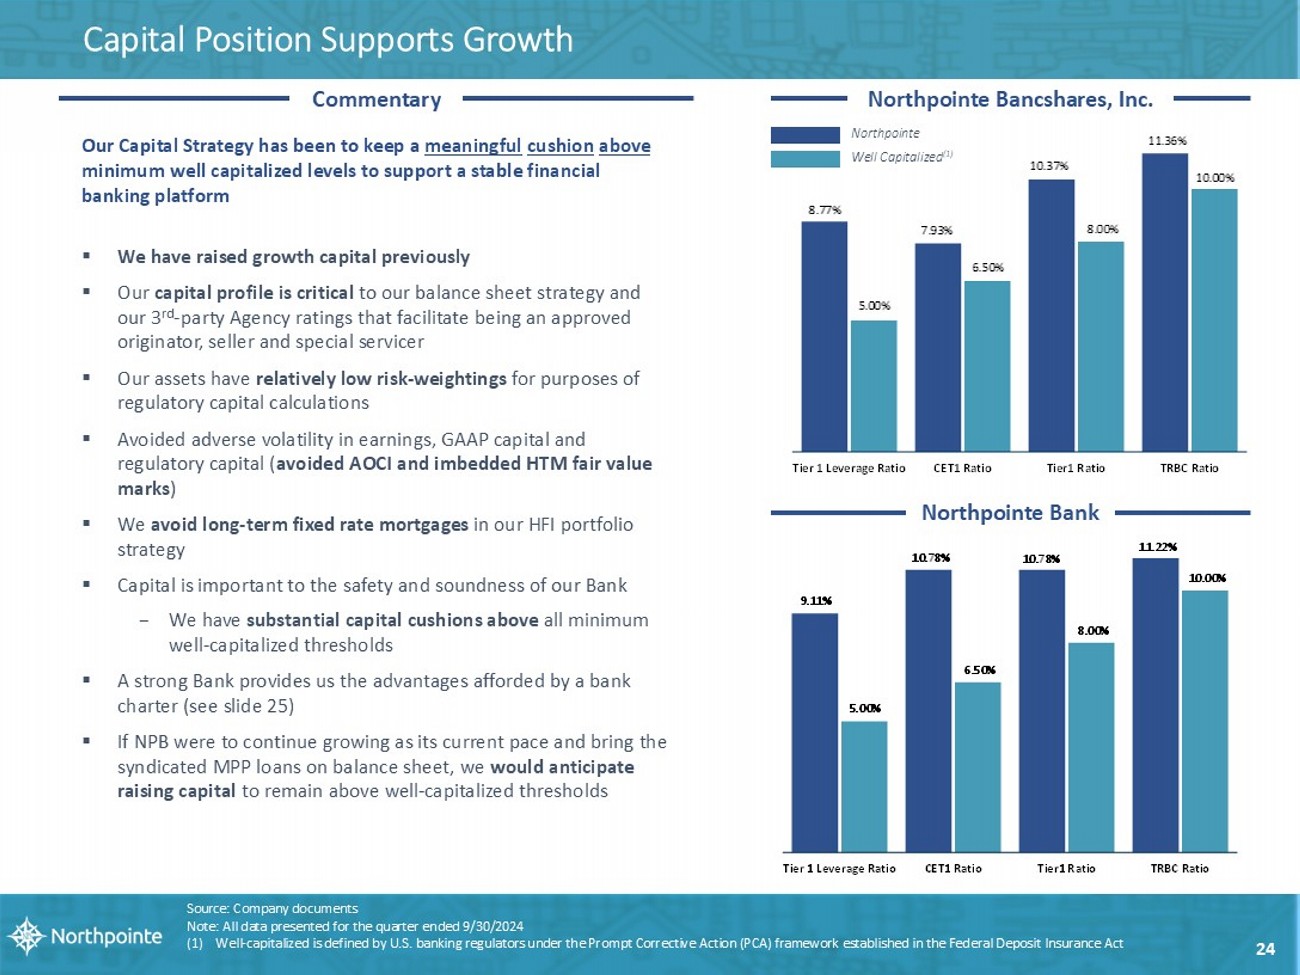
8.77% 7.93% 10.37% 11.36% 5.00% 6.50% 8.00% 10.00% Tier 1 Leverage Ratio CET1 Ratio Tier1 Ratio TRBC Ratio 9.11% 10.78% 10.78% 11.22% 5.00% 6.50% 8.00% 10.00% Tier 1 Leverage Ratio CET1 Ratio Tier1 Ratio TRBC Ratio Capital Position Supports Growth Northpointe Bancshares, Inc. Source: Company documents Note: All data presented for the quarter ended 9/30/2024 (1) Well - capitalized is defined by U.S. banking regulators under the Prompt Corrective Action (PCA) framework established in the Fed eral Deposit Insurance Act Northpointe Well Capitalized (1) Northpointe Bank Our Capital Strategy has been to keep a meaningful cushion above minimum w ell capitalized levels to support a stable financial banking platform ▪ We have raised growth capital previously ▪ Our capital profile is critical to our balance sheet strategy and our 3 rd - party Agency ratings that facilitate being an approved originator, seller and special servicer ▪ Our assets have relatively low risk - weightings for purposes of regulatory capital calculations ▪ Avoided adverse volatility in earnings, GAAP capital and regulatory capital ( avoided AOCI and imbedded HTM fair value marks ) ▪ We avoid long - term fixed rate mortgages in our HFI portfolio strategy ▪ Capital is important to the safety and soundness of our Bank − We have substantial capital cushions above all minimum well - capitalized thresholds ▪ A strong Bank provides us the advantages afforded by a bank charter (see slide 25) ▪ If NPB were to continue growing as its current pace and bring the syndicated MPP loans on balance sheet, we would anticipate raising capital to remain above well - capitalized thresholds Commentary 24
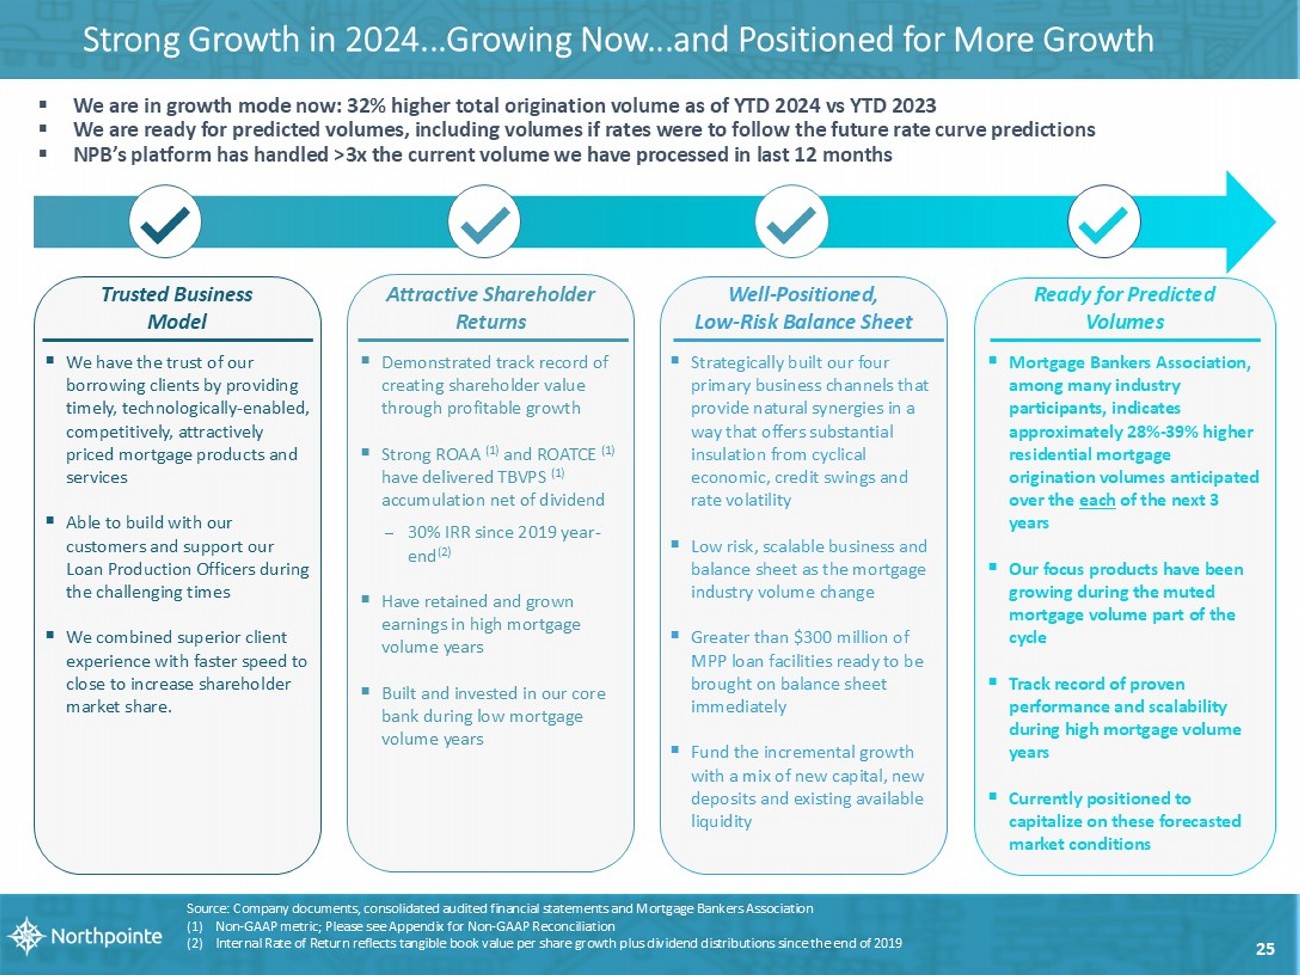
Strong Growth in 2024...Growing Now...and Positioned for More Growth Trusted Business Model ▪ We have the trust of our borrowing clients by providing timely, technologically - enabled, competitively, attractively priced mortgage products and services ▪ Able to build with our customers and support our Loan Production Officers during the challenging times ▪ We combined superior client experience with faster speed to close to increase shareholder market share. Well - Positioned, Low - Risk Balance Sheet ▪ Strategically built our four primary business channels that provide natural synergies in a way that offers substantial insulation from cyclical economic, credit swings and rate volatility ▪ Low risk, scalable business and balance sheet as the mortgage industry volume change ▪ Greater than $300 million of MPP loan facilities ready to be brought on balance sheet immediately ▪ Fund the incremental growth with a mix of new capital, new deposits and existing available liquidity Ready for Predicted Volumes ▪ Mortgage Bankers Association, among many industry participants, indicates approximately 28% - 39% higher residential mortgage origination volumes anticipated over the each of the next 3 years ▪ Our focus products have been growing during the muted mortgage volume part of the cycle ▪ Track record of proven performance and scalability during high mortgage volume years ▪ Currently positioned to capitalize on these forecasted market conditions ▪ Demonstrated track record of creating shareholder value through profitable growth ▪ Strong ROAA (1) and ROATCE (1) have delivered TBVPS (1) accumulation net of dividend – 30% IRR since 2019 year - end (2) ▪ Have retained and grown earnings in high mortgage volume years ▪ Built and invested in our core bank during low mortgage volume years Attractive Shareholder Returns 25 ▪ We are in growth mode now: 32% higher total origination volume as of YTD 2024 vs YTD 2023 ▪ We are ready for predicted volumes, including volumes if rates were to follow the future rate curve predictions ▪ NPB’s platform has handled >3x the current volume we have processed in last 12 months Source: Company documents, consolidated audited financial statements and Mortgage Bankers Association (1) Non - GAAP metric; Please see Appendix for Non - GAAP Reconciliation (2) Internal Rate of Return reflects tangible book value per share growth plus dividend distributions since the end of 2019

A PPENDIX
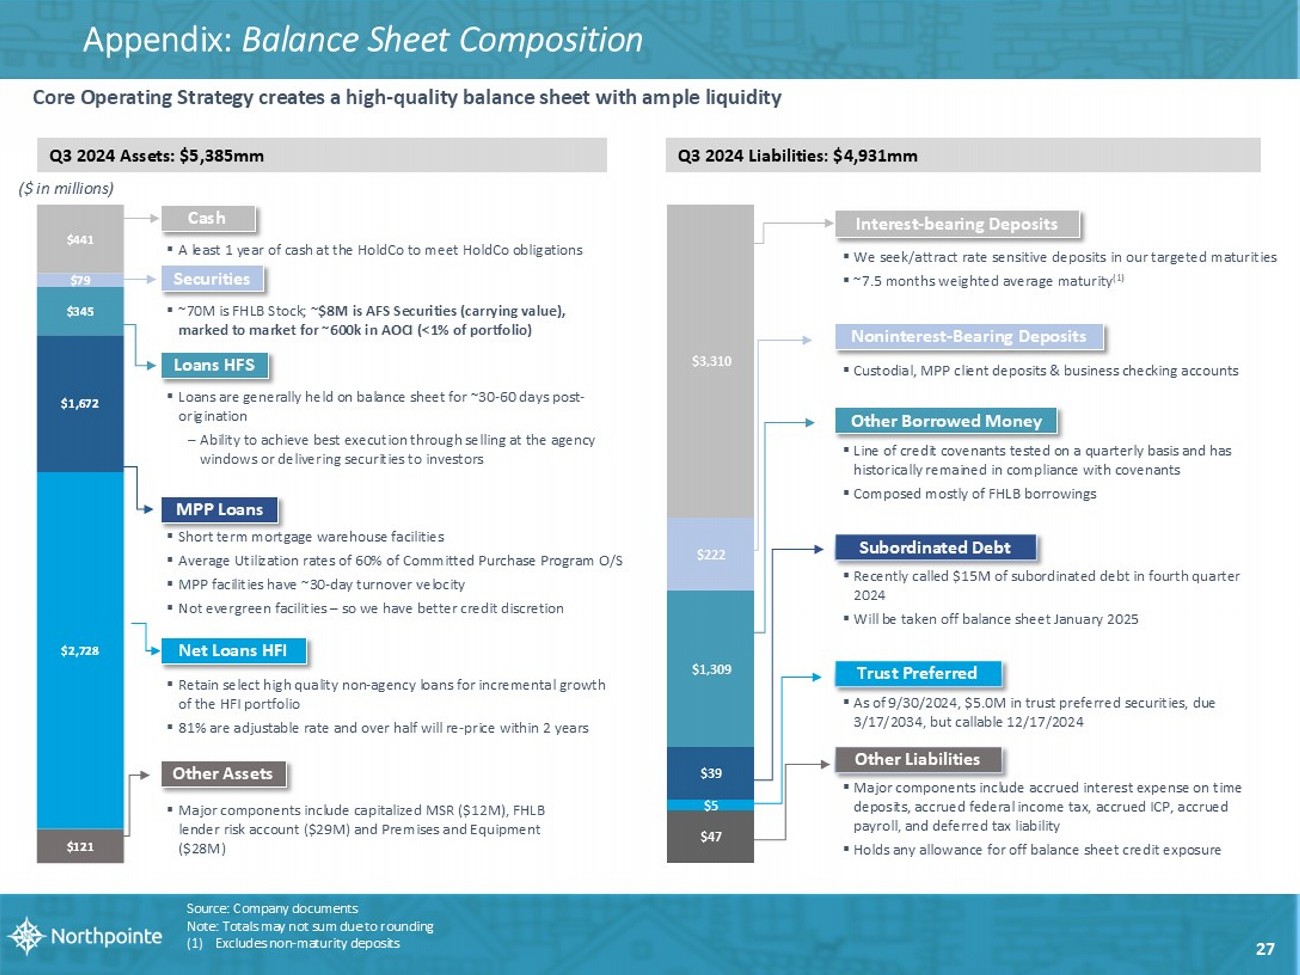
▪ Recently called $15M of subordinated debt in fourth quarter 2024 ▪ Will be taken off balance sheet January 2025 ▪ We seek/attract rate sensitive deposits in our targeted maturities ▪ ~7.5 months weighted average maturity (1) ▪ Major components include capitalized MSR ($12M), FHLB lender risk account ($29M) and Premises and Equipment ($28M) ▪ Retain select high quality non - agency loans for incremental growth of the HFI portfolio ▪ 81% are adjustable rate and over half will re - price within 2 years ▪ Loans are generally held on balance sheet for ~30 - 60 days post - origination – Ability to achieve best execution through selling at the agency windows or delivering securities to investors ▪ A least 1 year of cash at the HoldCo to meet HoldCo obligations ▪ Short term mortgage warehouse facilities ▪ Average Utilization rates of 60% of Committed Purchase Program O/S ▪ MPP facilities have ~30 - day turnover velocity ▪ Not evergreen facilities – so we have better credit discretion Appendix: Balance Sheet Composition Source: Company documents Note: Totals may not sum due to rounding (1) Excludes non - maturity deposits Core Operating Strategy creates a high - quality balance sheet with ample liquidity Q3 2024 Assets: $5,385mm Q3 2024 Liabilities: $4,931mm MPP Loans Securities Cash Other Assets Loans HFS ▪ ~70M is FHLB Stock; ~ $ 8 M is AFS Securities (carrying value), marked to market for ~600k in AOCI (<1% of portfolio) Net Loans HFI ($ in millions) Noninterest - Bearing Deposits Interest - bearing Deposits Other Liabilities Other Borrowed Money Trust Preferred ▪ As of 9/30/2024, $5.0M in trust preferred securities, due 3/17/2034, but callable 12/17/2024 ▪ Custodial, MPP client deposits & business checking accounts ▪ Line of credit covenants tested on a quarterly basis and has historically remained in compliance with covenants ▪ Composed mostly of FHLB borrowings Subordinated Debt ▪ Major components include accrued interest expense on time deposits, accrued federal income tax, accrued ICP, accrued payroll, and deferred tax liability ▪ Holds any allowance for off balance sheet credit exposure 27 $121 $2,728 $1,672 $345 $79 $441 $47 $5 $39 $1,309 $222 $3,310
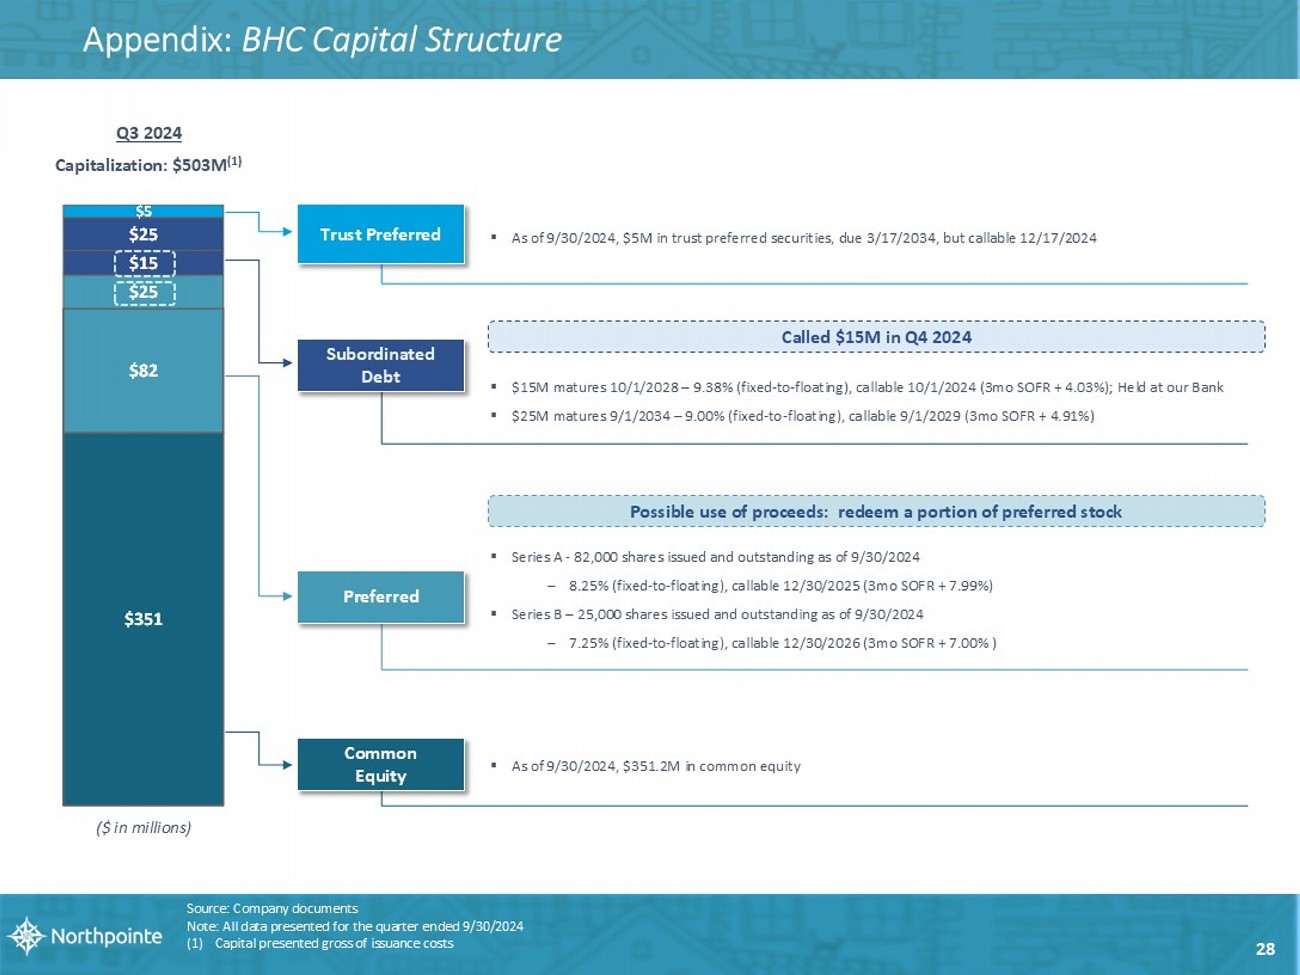
$351 $82 $25 $15 $25 $5 Appendix: BHC Capital Structure Preferred ▪ Series A - 82,000 shares issued and outstanding as of 9/30/2024 – 8.25% (fixed - to - floating), callable 12/30/2025 (3mo SOFR + 7.99%) ▪ Series B – 25,000 shares issued and outstanding as of 9/30/2024 – 7.25% (fixed - to - floating), callable 12/30/2026 (3mo SOFR + 7.00% ) Subordinated Debt Trust Preferred ▪ As of 9/30/2024, $5M in trust preferred securities, due 3/17/2034, but callable 12/17/2024 Q3 2024 Capitalization: $503M (1) Possible use of proceeds: redeem a portion of preferred stock ▪ $15M matures 10/1/2028 – 9.38% (fixed - to - floating), callable 10/1/2024 (3mo SOFR + 4.03%); Held at our Bank ▪ $25M matures 9/1/2034 – 9.00% (fixed - to - floating), callable 9/1/2029 (3mo SOFR + 4.91%) Called $15M in Q4 2024 Source: Company documents Note: All data presented for the quarter ended 9/30/2024 (1) Capital presented gross of issuance costs ($ in millions) 28 Common Equity ▪ As of 9/30/2024, $351.2M in common equity
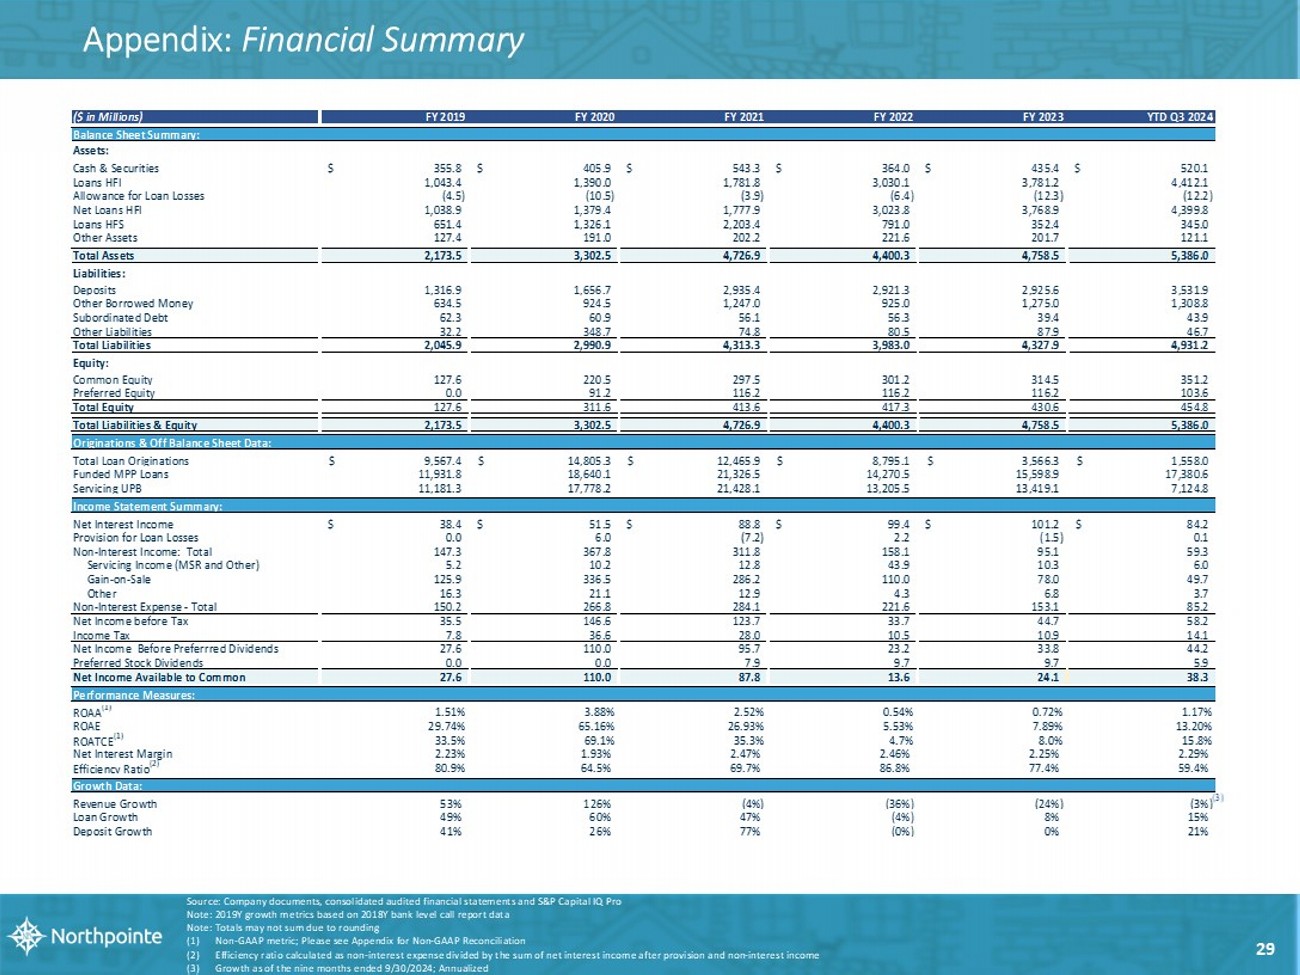
Appendix: Financial Summary Source: Company documents, consolidated audited financial statements and S&P Capital IQ Pro Note: 2019Y growth metrics based on 2018Y bank level call report data Note: Totals may not sum due to rounding (1) Non - GAAP metric; Please see Appendix for Non - GAAP Reconciliation (2) Efficiency ratio calculated as non - interest expense divided by the sum of net interest income after provision and non - interest i ncome (3) Growth as of the nine months ended 9/30/2024; Annualized 29 ($ in Millions) FY 2019 FY 2020 FY 2021 FY 2022 FY 2023 YTD Q3 2024 Balance Sheet Summary: Assets: Cash & Securities 355.8$ 405.9$ 543.3$ 364.0$ 435.4$ 520.1$ Loans HFI 1,043.4 1,390.0 1,781.8 3,030.1 3,781.2 4,412.1 Allowance for Loan Losses (4.5) (10.5) (3.9) (6.4) (12.3) (12.2) Net Loans HFI 1,038.9 1,379.4 1,777.9 3,023.8 3,768.9 4,399.8 Loans HFS 651.4 1,326.1 2,203.4 791.0 352.4 345.0 Other Assets 127.4 191.0 202.2 221.6 201.7 121.1 Total Assets 2,173.5 3,302.5 4,726.9 4,400.3 4,758.5 5,386.0 Liabilities: Deposits 1,316.9 1,656.7 2,935.4 2,921.3 2,925.6 3,531.9 Other Borrowed Money 634.5 924.5 1,247.0 925.0 1,275.0 1,308.8 Subordinated Debt 62.3 60.9 56.1 56.3 39.4 43.9 Other Liabilities 32.2 348.7 74.8 80.5 87.9 46.7 Total Liabilities 2,045.9 2,990.9 4,313.3 3,983.0 4,327.9 4,931.2 Equity: Common Equity 127.6 220.5 297.5 301.2 314.5 351.2 Preferred Equity 0.0 91.2 116.2 116.2 116.2 103.6 Total Equity 127.6 311.6 413.6 417.3 430.6 454.8 Total Liabilities & Equity 2,173.5 3,302.5 4,726.9 4,400.3 4,758.5 5,386.0 Originations & Off Balance Sheet Data: Total Loan Originations 9,567.4$ 14,805.3$ 12,465.9$ 8,795.1$ 3,566.3$ 1,558.0$ Funded MPP Loans 11,931.8 18,640.1 21,326.5 14,270.5 15,598.9 17,380.6 Servicing UPB 11,181.3 17,778.2 21,428.1 13,205.5 13,419.1 7,124.8 Income Statement Summary: Net Interest Income 38.4$ 51.5$ 88.8$ 99.4$ 101.2$ 84.2$ Provision for Loan Losses 0.0 6.0 (7.2) 2.2 (1.5) 0.1 Non-Interest Income: Total 147.3 367.8 311.8 158.1 95.1 59.3 Servicing Income (MSR and Other) 5.2 10.2 12.8 43.9 10.3 6.0 Gain-on-Sale 125.9 336.5 286.2 110.0 78.0 49.7 Other 16.3 21.1 12.9 4.3 6.8 3.7 Non-Interest Expense - Total 150.2 266.8 284.1 221.6 153.1 85.2 Net Income before Tax 35.5 146.6 123.7 33.7 44.7 58.2 Income Tax 7.8 36.6 28.0 10.5 10.9 14.1 Net Income Before Preferrred Dividends 27.6 110.0 95.7 23.2 33.8 44.2 Preferred Stock Dividends 0.0 0.0 7.9 9.7 9.7 5.9 Net Income Available to Common 27.6 110.0 87.8 13.6 24.1 38.3 Performance Measures: ROAA (1) 1.51% 3.88% 2.52% 0.54% 0.72% 1.17% ROAE 29.74% 65.16% 26.93% 5.53% 7.89% 13.20% ROATCE (1) 33.5% 69.1% 35.3% 4.7% 8.0% 15.8% Net Interest Margin 2.23% 1.93% 2.47% 2.46% 2.25% 2.29% Efficiency Ratio (2) 80.9% 64.5% 69.7% 86.8% 77.4% 59.4% Growth Data: Revenue Growth 53% 126% (4%) (36%) (24%) (3%) Loan Growth 49% 60% 47% (4%) 8% 15% Deposit Growth 41% 26% 77% (0%) 0% 21% (3)
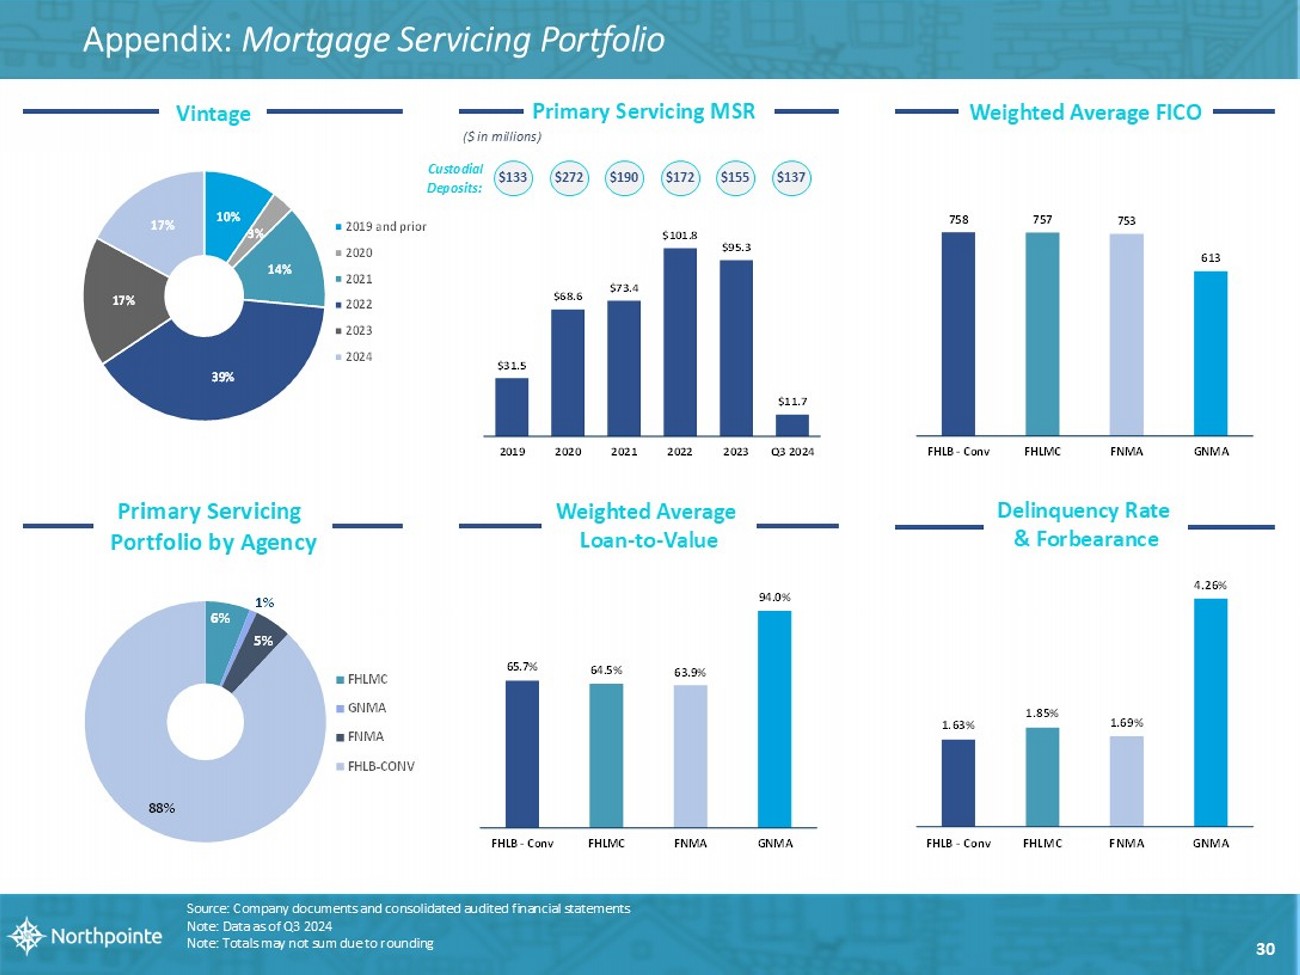
Appendix: Mortgage Servicing Portfolio $31.5 $68.6 $73.4 $101.8 $95.3 $11.7 2019 2020 2021 2022 2023 Q3 2024 Primary Servicing MSR Custodial Deposits: 6% 1% 5% 88% FHLMC GNMA FNMA FHLB-CONV ($ in millions) Source: Company documents and consolidated audited financial statements Note: Data as of Q3 2024 Note: Totals may not sum due to rounding $133 $272 $190 $172 $155 $137 10% 3% 14% 39% 17% 17% 2019 and prior 2020 2021 2022 2023 2024 Vintage 758 757 753 613 FHLB - Conv FHLMC FNMA GNMA Weighted Average FICO 65.7% 64.5% 63.9% 94.0% FHLB - Conv FHLMC FNMA GNMA Weighted Average Loan - to - Value 1.63% 1.85% 1.69% 4.26% FHLB - Conv FHLMC FNMA GNMA Delinquency Rate & Forbearance Primary Servicing Portfolio by Agency 30
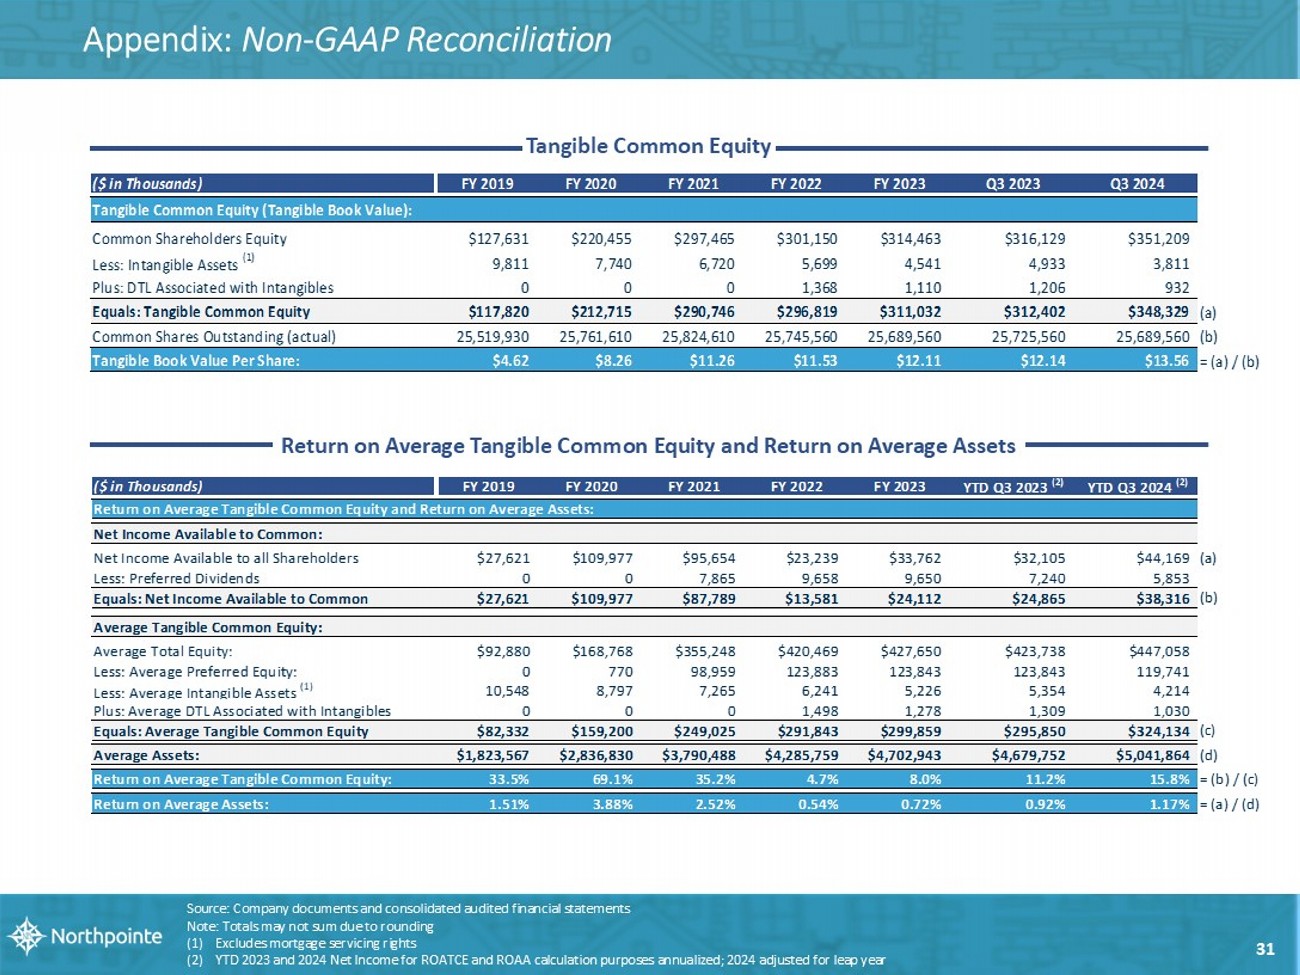
Appendix: Non - GAAP Reconciliation Source: Company documents and consolidated audited financial statements Note: Totals may not sum due to rounding (1) Excludes mortgage servicing rights (2) YTD 2023 and 2024 Net Income for ROATCE and ROAA calculation purposes annualized; 2024 adjusted for leap year Tangible Common Equity Return on Average Tangible Common Equity and Return on Average Assets 31 ($ in Thousands) FY 2019 FY 2020 FY 2021 FY 2022 FY 2023 Q3 2023 Q3 2024 Tangible Common Equity (Tangible Book Value): Common Shareholders Equity $127,631 $220,455 $297,465 $301,150 $314,463 $316,129 $351,209 Less: Intangible Assets (1) 9,811 7,740 6,720 5,699 4,541 4,933 3,811 Plus: DTL Associated with Intangibles 0 0 0 1,368 1,110 1,206 932 Equals: Tangible Common Equity $117,820 $212,715 $290,746 $296,819 $311,032 $312,402 $348,329 (a) Common Shares Outstanding (actual) 25,519,930 25,761,610 25,824,610 25,745,560 25,689,560 25,725,560 25,689,560 (b) Tangible Book Value Per Share: $4.62 $8.26 $11.26 $11.53 $12.11 $12.14 $13.56 = (a) / (b) ($ in Thousands) FY 2019 FY 2020 FY 2021 FY 2022 FY 2023 YTD Q3 2023 (2) YTD Q3 2024 (2) Return on Average Tangible Common Equity and Return on Average Assets: Net Income Available to Common: Net Income Available to all Shareholders $27,621 $109,977 $95,654 $23,239 $33,762 $32,105 $44,169 (a) Less: Preferred Dividends 0 0 7,865 9,658 9,650 7,240 5,853 Equals: Net Income Available to Common $27,621 $109,977 $87,789 $13,581 $24,112 $24,865 $38,316 (b) Average Tangible Common Equity: Average Total Equity: $92,880 $168,768 $355,248 $420,469 $427,650 $423,738 $447,058 Less: Average Preferred Equity: 0 770 98,959 123,883 123,843 123,843 119,741 Less: Average Intangible Assets (1) 10,548 8,797 7,265 6,241 5,226 5,354 4,214 Plus: Average DTL Associated with Intangibles 0 0 0 1,498 1,278 1,309 1,030 Equals: Average Tangible Common Equity $82,332 $159,200 $249,025 $291,843 $299,859 $295,850 $324,134 (c) Average Assets: $1,823,567 $2,836,830 $3,790,488 $4,285,759 $4,702,943 $4,679,752 $5,041,864 (d) Return on Average Tangible Common Equity: 33.5% 69.1% 35.2% 4.7% 8.0% 11.2% 15.8% = (b) / (c) Return on Average Assets: 1.51% 3.88% 2.52% 0.54% 0.72% 0.92% 1.17% = (a) / (d)