10-K: Annual report [Section 13 and 15(d), not S-K Item 405]
Published on March 28, 2025
UNITED STATES
SECURITIES AND EXCHANGE COMMISSION
Washington, D.C. 20549
___________________________
FORM 10-K
___________________________
(Mark One)
| ANNUAL REPORT PURSUANT TO SECTION 13 OR 15(d) OF THE SECURITIES EXCHANGE ACT OF 1934 | |||||
For the fiscal year ended December 31, 2024
OR
| TRANSITION REPORT PURSUANT TO SECTION 13 OR 15(d) OF THE SECURITIES EXCHANGE ACT OF 1934 | |||||
For the transition period from January 1, 2024 to December 31 , 2024
Commission file number 333-284419
___________________________
___________________________
(Exact name of registrant as specified in its charter)
| (State or other jurisdiction of incorporation or organization) | (I.R.S. Employer Identification No.) | ||||||||||
|
|
|||||||||||
| (Address of Principal Executive Offices) | (Zip Code) | ||||||||||
(616 ) 940-9400
Registrant’s telephone number, including area code
Securities registered pursuant to Section 12(b) of the Act:
| Title of each class | Trading Symbol(s) | Name of each exchange on which registered | ||||||
Securities registered pursuant to section 12(g) of the Act:
Common Shares
(Title of class)
Indicate by check mark if the registrant is a well-known seasoned issuer, as defined in Rule 405 of the Securities Act.
Yes o No x
Indicate by check mark if the registrant is not required to file reports pursuant to Section 13 or Section 15(d) of the Act.
Yes o No x
Indicate by check mark whether the registrant (1) has filed all reports required to be filed by Section 13 or 15(d) of the Securities Exchange Act of 1934 during the preceding 12 months (or for such shorter period that the registrant was required to file such reports), and (2) has been subject to such filing requirements for the past 90 days.
Indicate by check mark whether the registrant has submitted electronically every Interactive Data File required to be submitted pursuant to Rule 405 of Regulation S-T (§ 232.405 of this chapter) during the preceding 12 months (or for such shorter period that the registrant was required to submit such files).
Indicate by check mark whether the registrant is a large accelerated filer, an accelerated filer, a non-accelerated filer, a smaller reporting company, or an emerging growth company. See the definitions of “large accelerated filer,” “accelerated filer,” “smaller reporting company, ”and "emerging growth company" in Rule 12b-2 of the Exchange Act.
| Large accelerated filer | o | Accelerated filer | o | |||||||||||
| x | Smaller reporting company | |||||||||||||
| Emerging growth company | ||||||||||||||
If an emerging growth company, indicate by check mark if the registrant has elected not to use the extended transition period for complying with any new or revised financial accounting standards provided pursuant to Section 13(a) of the Exchange Act.
Indicate by check mark whether the registrant has filed a report on and attestation to its management’s assessment of the effectiveness of its internal control over financial reporting under Section 404(b) of the Sarbanes-Oxley Act (15 U.S.C. 7262(b)) by the registered public accounting firm that prepared or issued its audit report.
If securities are registered pursuant to Section 12(b) of the Act, indicate by check mark whether the financial statements of the registrant included in the filing reflect the correction of an error to previously issued financial statements.
Indicate by check mark whether any of those error corrections are restatements that required a recovery analysis of incentive-based compensation received by any of the registrant’s executive officers during the relevant recovery period pursuant to §240.10D-1(b).
o
Indicate by check mark whether the registrant is a shell company (as defined in Rule 12b-2 of the Act).
Yes o No x
The registrant closed the initial public offering of its common stock on February 18, 2025. Accordingly, as of June 30, 2024, there was no public trading market for the registrant’s common stock.
As of March 28, 2025, there were 34,304,560 shares of the registrant’s Common Stock outstanding.
DOCUMENTS INCORPORATED BY REFERENCE
Portions of the Proxy Statement for the 2025 Annual Meeting of Shareholders are incorporated by reference in Part III of this Form 10-K.
Table of Contents
F-1 |
||||||||
i
CAUTIONARY NOTE REGARDING FORWARD-LOOKING STATEMENTS
This report contains forward-looking statements that are based on management's beliefs, assumptions, current expectations, estimates and projections about the financial services industry, the economy, and Northpointe Bancshares, Inc. Forward-looking statements are identifiable by words or phrases such as “outlook”, “plan” or “strategy”; that an event or trend “could”, “may”, “should”, “will”, “is likely”, or is “possible” or “probable” to occur or “continue”, has “begun” or “is scheduled” or “on track” or that the Company or its management “anticipates”, “believes”, “estimates”, “plans”, “forecasts”, “intends”, “predicts”, “projects”, or “expects” a particular result, or is “committed”, “confident”, “optimistic” or has an “opinion” that an event will occur, or other words or phrases such as “ongoing”, “future”, “signs”, “efforts”, “tend”, “exploring”, “appearing”, “until”, “near term”, “concern”, “going forward”, “focus”, “starting”, “initiative,” “trend” and variations of such words and similar expressions.
Such statements are based upon current beliefs and expectations and involve substantial risks and uncertainties which could cause actual results to differ materially from those expressed or implied by such forward-looking statements. These statements include, among others, those related to future levels of earning assets, future composition of our loan portfolio, trends in credit quality metrics, future capital levels and capital needs, real estate valuation, future levels of repossessed and foreclosed properties and nonperforming assets, future levels of losses and costs associated with the administration and disposition of repossessed and foreclosed properties and nonperforming assets, future levels of loan charge-offs, future levels of other real estate owned, future levels of provisions for credit losses and reserve recoveries, the rate of asset dispositions, future dividends, future growth and funding sources, future cost of funds, future liquidity levels, future profitability levels, future interest rate levels, future net interest margin levels, the effects on earnings of changes in interest rates, future economic conditions, future effects of new or changed accounting standards, future loss recoveries, loan demand and loan growth, future amounts of unrecognized tax benefits and the future level of other revenue sources. Management's determination of the provision and allowance for credit losses, the appropriate carrying value of intangible assets (including deferred tax assets) and other real estate owned, and the fair value of investment securities involves judgments that are inherently forward-looking. All statements with references to future time periods are forward-looking. All of the information concerning interest rate sensitivity is forward-looking. Our ability to sell other real estate owned at its carrying value or at all, successfully implement new programs and initiatives, increase efficiencies, maintain our current levels of deposits and other sources of funding, maintain liquidity, respond to declines in collateral values and credit quality, respond to a changing interest rate environment, increase loan volume, originate high quality loans, maintain or improve mortgage banking income, realize the benefit of our deferred tax assets, continue payment of dividends and improve profitability is not entirely within our control and is not assured. The future effect of changes in the real estate, financial and credit markets and the national and regional economy on the banking industry, generally, and Northpointe Bancshares, Inc., specifically, are also inherently uncertain.
These statements are not guarantees of future performance and involve certain risks, uncertainties and assumptions (“risk factors”) that are difficult to predict with regard to timing, extent, likelihood and degree of occurrence. Therefore, actual results and outcomes may materially differ from what may be expressed or forecasted in such forward-looking statements.
Risk factors include, but are not limited to, the risk factors described in “Item 1A - Risk Factors” of this report. These and other factors are representative of the risk factors that may emerge and could cause a difference between an ultimate actual outcome and preceding forward-looking statements.
A number of important factors could cause our actual results to differ materially from those indicated in these forward-looking statements, including those factors discussed elsewhere in this annual report and the following:
•general economic and business conditions in our local markets, including conditions affecting employment levels, interest rates, inflation, the threat of recession, volatile equity capital markets, property and casualty insurance costs, collateral values, customer income, creditworthiness and confidence, spending and savings that may affect customer bankruptcies, defaults, charge-offs and deposit activity; and the impact of the foregoing on customer and client behavior (including the velocity and levels of deposit withdrawals and loan repayment);
•changes in the interest rate environment (including changes to the federal funds rate and the impact on the level and composition of deposits (as well as the cost of, and competition for, deposits), loan demand, liquidity and the values of loan collateral, securities and market fluctuations, and interest rate sensitive assets and liabilities), and competition in our markets may result in increased funding costs or reduced earning assets yields, thus reducing our margins and net interest income;
ii
•adverse developments in the banking industry highlighted by high-profile bank failures and the impact of such developments on customer confidence, liquidity and regulatory responses to these developments (including increases in the cost of our deposit insurance assessments and increased regulatory scrutiny), our ability to effectively manage our liquidity risk and any growth plans and the availability of capital and funding;
•our ability to comply with applicable capital and liquidity requirements, including our ability to generate liquidity internally or raise capital on favorable terms, including continued access to the debt and equity capital markets;
•the risk that a future economic downturn and contraction could have a material adverse effect on our capital, financial condition, credit quality, results of operations and future growth, including the risk that the strength of the current economic environment could be weakened by the continued impact of elevated or rising interest rates and inflation;
•factors that can impact the performance of our loan portfolio, including real estate values and liquidity in our primary market areas, the financial health of our borrowers and the success of various projects that we finance;
•changes in the prices, values and sales volumes of commercial and residential real estate, especially as they relate to the value of collateral supporting the Company’s loans;
•weakness in the real estate market, including the secondary residential mortgage market, which can affect, among other things, the value of collateral securing mortgage loans, mortgage loan originations and delinquencies, profits on sales of mortgage loans, and the value of mortgage servicing rights;
•credit and lending risks associated with our loan portfolios;
•negative impact on our mortgage banking services, including declines in our mortgage originations or profitability due to prolonged elevated or rising interest rates and increased competition and regulation, the Bank’s or third party’s failure to satisfy mortgage servicing obligations, loan modifications, the effects of judicial or regulatory requirements or guidance, and the possibility of the Bank being required to repurchase mortgage loans or indemnify buyers;
•the impact of prolonged elevated interest rates on our financial projections, models and guidance;
•our ability to attract sufficient loans that meet prudent credit standards;
•our ability to attract and maintain business banking relationships with well-qualified businesses, real estate developers and investors with proven track records in our market areas;
•our ability to successfully manage our credit risk and the sufficiency of our allowance for credit losses (“ACL”);
•the adequacy of our reserves (including ACL) and the appropriateness of our methodology for calculating such reserves;
•our ability to successfully execute our business strategy to achieve profitable growth;
•the concentration of our business within our geographic areas of operation;
•our ability to manage our growth;
•our ability to increase our operating efficiency;
•significant turbulence or a disruption in the capital or financial markets and the effect of a fall in stock market prices on our investment securities;
•risks that our cost of funding could increase, in the event we are unable to continue to attract stable, low-cost deposits and reduce our cost of deposits;
•inability of our risk management framework (including internal controls) to effectively mitigate credit risk, interest rate risk, liquidity risk, price risk, compliance risk, operational risk (including by virtue of our relationships with third-party business partners, as well as our relationships with third-party vendors and other service providers), strategic risk, reputational risk and other risks inherent to the business of banking;
•our ability to maintain expenses in line with current projections;
•the makeup of our asset mix and investments;
•external economic, political and/or market factors, such as changes in monetary and fiscal policies and laws, and also including the interest rate policies of the Federal Reserve, inflation or deflation, changes in the demand for loans, and fluctuations in consumer spending, borrowing and savings habits, which may have an adverse impact on our financial condition;
iii
•the institution and outcome of litigation and other legal proceeding against us or to which we may become subject to and the potential effect of our reputation;
•the impact of recent and future legislative and regulatory changes;
•uncertainties surrounding geopolitical events, trade policy, taxation policy, and monetary policy which continue to impact the outlook for future economic growth, including U.S. imposition of tariffs against Mexico, Canada, and China and consideration of responsive actions by these nations or the expansion of import fees and tariffs among a larger group of nations, which is bringing greater ambiguity to the outlook for future economic growth;
•the potential implementation of a regulatory reform agenda under the new presidential administration that is significantly different than that of the prior administration, impacting rulemaking, supervision, examination and enforcement priorities of the federal banking agencies;
•examinations by our regulatory authorities;
•continued or increasing competition from other financial institutions, credit unions, and non-bank financial services companies (including fintech companies), many of which are subject to different regulations than we are;
•challenges arising from unsuccessful attempts to expand into new geographic markets, products, or services;
•restraints on the ability of the Bank to pay dividends to us, which could limit our liquidity;
•increased capital requirements imposed by banking regulators, which may require us to raise capital at a time when capital is not available on favorable terms or at all;
•inaccuracies in our assumptions about future events, which could result in material differences between our financial projections and actual financial performance;
•changes in our management personnel or our inability to retain motivate and hire qualified management personnel;
•the dependence of our operating model on our ability to attract and retain experienced and talented bankers in each of our markets, which may be impacted as a result of labor shortages;
•our ability to identify and address cyber-security risks, fraud and systems errors, including the impact on our reputation and the costs and effects required to address such risks, fraud and systems errors;
•disruptions, security breaches, or other adverse events, failures or interruptions in, or attacks on, our information technology systems, which may be exacerbated by the development of generative artificial intelligence, and the cost of defending against them and any reputational or other financial risks following such a cybersecurity incident;
•our business relationships with, and reliance upon, third parties that have strategic partnerships with us or that provide key components of our business infrastructure, including the costs of services and products provided to us by third parties, and disruptions in service, security breaches, financial difficulties with or other adverse events affecting a third-party vendor or business relationship;
•an inability to keep pace with the rate of technological advances due to a lack of resources to invest in new technologies;
•fraudulent and negligent acts by our clients, employees or vendors and our ability to identify and address such acts;
•risks related to potential acquisitions;
•the impact of any claims or legal actions to which we may be subject, including any effect on our reputation;
•compliance with governmental and regulatory requirements, including the Dodd-Frank Act and others relating to banking, consumer protection, securities and tax matters, and our ability to maintain licenses required in connection with commercial mortgage origination, sale and servicing operations;
•changes in the scope and cost of Federal Deposit Insurance Corporation (“FDIC”) insurance and other coverage;
•changes in our accounting standards;
•changes in tariffs and trade barriers;
•changes in federal tax law or policy;
•the effects of war or other conflicts, civil unrest, acts of terrorism, acts of God, natural disasters, health emergencies, epidemics or pandemics, climate changes, or other catastrophic events that may affect general economic conditions or
iv
cause other disruptions and/or increase costs, including, but not limited to, property and casualty and other insurance cost;
•risks related to diversity, equity and inclusion (“DEI”) and environmental, social and governance ("ESG") strategies and initiatives, the scope and pace of which could alter the Company’s reputation and stockholder, associate, customer and third-party affiliations or result in litigation in connection with anti-DEI and anti-ESG laws, rules or activism;
•a deterioration of the credit rating for U.S. long-term sovereign debt, actions that the U.S. government may take to avoid exceeding the debt ceiling, and uncertainties surrounding the debt ceiling and the federal budget; and
•other risks and factors identified in this Form 10-K under the heading “Risk Factors” and “Management’s Discussion and Analysis of Financial Condition and Results of Operations” section herein.
The foregoing factors should not be construed as exhaustive and should be read together with the other cautionary statements included in this Annual Report on Form 10-K. Because of these risks and other uncertainties, our actual future results, performance or achievement, or industry results, may be materially different from the results indicated by the forward looking statements in this Annual Report on Form 10-K. In addition, our past results of operations are not necessarily indicative of our future results. You should not rely on any forward looking statements, which represent our beliefs, assumptions and estimates only as of the dates on which they were made, as predictions of future events. Any forward-looking statement speaks only as of the date on which it is made, and we do not undertake any obligation to update or review any forward-looking statement, whether as a result of new information, future developments or otherwise.
v
Part I
Item 1. Business
As used in this report, the terms “we”, “us”, “our”, “Northpointe”, and “Company” mean Northpointe Bancshares, Inc. and its subsidiaries, unless the context indicates another meaning. The term “Bank” means Northpointe Bank.
Our Business
Company Overview
Northpointe Bancshares, Inc. (“the Company”) is a bank holding company headquartered in Grand Rapids, Michigan and registered under the Bank Holding Company Act of 1956. Our Bank was founded in 1999 as a focused mortgage portfolio lender primarily operating in the midwestern states of Michigan, Ohio and Indiana. Presently, the Bank also offers a nationwide mortgage purchase program, residential mortgage lending, digital deposit banking to our retail customers and custodial deposit services to our loan servicing clients. Our delivery systems are primarily digital and are available to clients nationwide; and we provide our staff with loan production offices across 23 cities in 15 states and support them through our centralized operating center in Grand Rapids, Michigan. Our nationwide presence has enabled us to have clients in all 50 states and the District of Columbia. As of December 31, 2024, we had $5.22 billion in assets, $4.64 billion in gross loans, including held for investment (“HFI”) and held for sale (“HFS”), $3.42 billion of deposits and $462.5 million of stockholders’ equity. We have originated more than $190 billion in home loan financings over the last 10 years, making us one of the largest mortgage-focused banks in the United States.
In the large and fragmented mortgage marketplace, we believe we are well-positioned as a specialty bank that uses a widely accepted and growing digitally-enabled platform to serve the borrowing and payment needs of increasingly sophisticated mortgage warehouse clients and the rapidly evolving demands of professional mortgage originators and retail borrowers.
We have strategically built our primary business channels to provide us with synergies across our lines of business. We believe this approach offers us substantial insulation from cyclical economic changes, credit swings and rate volatility. Within our lines of business, we pursue very focused strategies that we believe have (1) historically proven to be well received by borrowers, (2) allowed us to differentiate ourselves from the competition and (3) resulted in strong financial performance during high volume cycles and durable performance during low volume cycles. We believe our platform has been able to dynamically and profitably scale up and down with the changes in volume in the mortgage industry. We have demonstrated an ability to generate and scale revenues while proactively managing variable costs and containing fixed costs, resulting in attractive financial results. As evidence of our platform’s proactive adaptability, we completed our strategic repositioning efforts over 23 months starting in 2022, which included the following: (i) quickly exiting the correspondent lending business as margins declined in the sector, (ii) entering into private- labelled subservicing agreements for non-specialized mortgage products, such as conforming agency mortgage loans, and (iii) remixing our available lending capacities by (a) increasing Mortgage Purchase Program clients and balances as other lenders exited the sector and (b) holding more specialized residential loan products. These actions resulted in long-term cost reductions that outpaced revenue reduction which, in combination with increased yields on assets, delivered strong performance metrics and substantial growth in profitability for 2024 compared to 2023. These strategic actions are consistent with our rate, liquidity and credit risk strategies.
Business Segments
We offer financial products and services through our two primary business segments, Mortgage Purchase Program and Retail Banking.
Mortgage Purchase Program (“MPP”) — Through our Mortgage Purchase Program business (which we refer to as Mortgage Purchase Program, or “MPP”), we provide independent mortgage banking platforms nationwide with an alternative to traditional mortgage warehouse lending. MPP utilizes a collateralized mortgage purchase facility, marketed to independent mortgage bankers nationwide. These facilities enable our MPP clients to close and fund their mortgages and during a relatively short period (typically less than 30 days), the originated loans are sold into the secondary market via government agencies (Fannie Mae, Freddie Mac or Ginnie Mae) or institutional investors (banks, large mortgage companies, insurance companies, mortgage REIT’s) or are securitized. Our MPP facilities provide a key source of liquidity to the residential mortgage marketplace.
1
Retail Banking — Our Retail Banking business includes residential lending, digital deposit banking and loan servicing.
(a)Residential Lending — Our residential lending division provides a comprehensive range of financing options for home purchases and refinancing, serving borrowers nationwide through two main channels: Consumer Direct and Traditional Retail. These channels combine the convenience of online, self-service platforms with the personalized service of traditional, referral-based interactions. Through our point of sale platform, borrowers can easily apply for loans, upload documents, speak with loan officers, track progress, and make payments — all from one secure, user-friendly interface. Northpointe offers a broad spectrum of loan programs, including conventional, government, and non-QM loans, catering to a wide variety of borrowers’ needs. As a direct seller/servicer to Fannie Mae, Freddie Mac, and Ginnie Mae, we ensure competitive rates and efficient processing. With a focus on speed, quality, and client satisfaction, we leverage our customized technology in our underwriting process, leading to faster decisions and document delivery.
We also specialize in the origination and servicing of first-lien home equity lines which are tied seamlessly to a demand deposit sweep account through our proprietary technology (we commonly refer to these loans as “All-in-One” or “AIO” loans). These first-lien home equity lines combine the benefits of a revolving equity line of credit, a market rate cost of a first mortgage and the sweep benefits of a deposit account. The borrower benefits through reduced interest charges on the credit line as a result of the daily sweep from the linked bank checking account.
Our digitized loan origination processes give borrowers and origination professionals easy access to our proprietary Apps and POS support features to quickly, intelligently, and securely gather personal and loan information. Borrowers also have access to account advisors to help borrowers on their journey when they need human assistance. We believe our processes have allowed us to improve upon traditional mortgage offering with products advancements such as: Lock & Shop, Temporary Buydown, TrueApproval, Delayed Financing, and Rate Refresh along with Jumbo, Renovation, traditional HELOC, VA Loans and our first-lien home equity loans.
(b)Digital Deposit Banking — Our automated account opening, direct to customer deposit platform and product suite provide our depositors with effective, competitive, modern digital banking services and provide us with reliable access to deposit funding. We offer and utilize the full spectrum of deposit products, including noninterest- bearing accounts, savings, money-market demand accounts; but we focus upon term CDs. Our digital platform (supported by one central branch) offers very competitive rates that allow us to attract deposits at an attractive all-in cost to us. Historically, the majority of our time deposits were term CDs that were structured with intermediate (close to one year) maturities and priced at rates that are in the top 25 of average nationwide industry deposit rates for similar maturities. Beyond term and rate, we successfully compete with other digital- only banks by offering a simple online account opening experience, friendly features such as ATM fee rebates, no/low overdraft fees and a dynamic mobile banking solution. In addition to retail deposits, we offer commercial deposits which are primarily noninterest bearing custodial deposits related to our loan servicing business. As of December 31, 2024, our deposit balances were $3.42 billion, of which $208.9 million were non-interest bearing accounts, primarily comprised of servicing-related custodial deposits and deposits from our MPP clients. Custodial deposits and deposits from our MPP clients are both contractually obligated to remain at Northpointe unless we are not well-capitalized.
(c)Loan Servicing — We service and sub-service specialized loans on behalf of our borrowers and investors, which includes a monthly fee paid by the investor. In 2024, we refined our servicing strategy to focus solely on in-house servicing of select loan types such as first-lien home equity lines which are tied seamlessly to a demand deposit sweep account through our proprietary technology; and the private label outsourcing of non-specialized mortgage servicing to a scaled sub-servicer. Our servicing duties include handling the recording, acceptance, and remittance of principal and interest payments from borrowers, holding FDIC-insured deposits, calculating variable rate interest payments, as well as the administration of taxes, insurance and escrow payments, as applicable; and may also include negotiations of loan workouts and modifications upon default or other proceedings. Critical to the success of our servicing platform is being an approved seller/servicer for the largest government-related mortgage agencies (FNMA, FNMA, FHLMC, FHLB) as well as being rated by a third-party rating agency (Fitch) as a qualified servicer for investor-owned securitizations and other non-agency products.
We completed an initial public offering of our common stock in February 2025 as an emerging growth company under the Jumpstart Our Business Startups Act of 2012 (“the JOBS Act”). Our common stock is listed on the New York Stock Exchange under the symbol “NPB”.
Market Area
While our headquarters is located in Grand Rapids, Michigan, our market area is nationwide. Our delivery systems are primarily digital and are available to clients nationwide; and we provide our staff with loan production offices across 23 cities
2
in 15 states and support them through our centralized operating center in Grand Rapids, Michigan. Our nationwide presence has enabled us to have clients in all 50 states and the District of Columbia.
Competition
We compete in a number of areas, including deposit banking, residential mortgage lending and servicing, and mortgage warehouse lending. These industries are highly competitive, and our Bank faces strong direct competition for loans and deposits. We compete with other nondepository financial institutions and community banks, thrifts and credit unions. In addition, we compete with large banks and other financial intermediaries, such as consumer finance companies, mortgage banking companies, and online banks.
Continued consolidation and rapid technological changes within the financial services industry will likely change the nature and intensity of competition, but also will create opportunities for the Company to demonstrate and leverage its competitive advantages. The continuing consolidation within the financial services industry is leading to larger, better capitalized and geographically diverse institutions with enhanced product and technology capabilities. Additionally, competition from fintechs is increasing. In addition to fintechs, certain technology companies are working to provide financial services directly to their customers. These nontraditional financial service providers have been successful in developing digital and other products and services that effectively compete with traditional banking services, but are in some cases subject to fewer regulatory restrictions than banks and bank holding companies, allowing them to operate with greater flexibility and lower cost structures.
Competitors include not only financial institutions based in Michigan, but also a number of large out-of-state and foreign banks, bank holding companies and other financial institutions that have an established market presence in Michigan or that offer internet-based products. Many of the Company's competitors are engaged in local, regional, national and international operations and have greater assets, personnel and other resources. Some of these competitors are subject to less regulation and/or more favorable tax treatment. Many of these institutions have greater resources, broader geographic markets and higher lending limits, and may offer services that the Company does not offer. In addition, these institutions may be able to better afford and make broader use of media advertising, support services, and electronic and other technology. To offset these potential competitive disadvantages, the Company depends on its reputation for superior service, ability to make credit and other business decisions quickly, and the delivery of an integrated distribution of a traditional branch and bankers, with digital technology. We believe that the range and quality of products that we offer, the knowledge of our personnel and our emphasis on building long-lasting relationships sets us apart from our competitors.
Risk Management
We believe that effective risk management and control processes are critical to our safety and soundness, our ability to predict and manage the challenges that we face and, ultimately, our long-term corporate success. Risk management refers to the activities by which we identify, measure, monitor, evaluate and manage the risks we face in the course of our banking activities. These include liquidity, interest rate, credit, operational, compliance, regulatory, strategic, financial and reputational risk exposures. Our board of directors, both directly and through its committees, is responsible for overseeing our risk management processes, including routinely conducting enterprise risk management assessments, cyber, BSA/anti-money laundering and third-party risk assessments, with each of the committees of our board of directors assuming a different and important role in overseeing the management of the risks we face.
The Audit Committee of our board of directors is responsible for overseeing risks associated with financial matters (particularly financial reporting, accounting practices and policies, disclosure controls and procedures and internal control over financial reporting). The Compensation Committee of our board of directors has primary responsibility for risks and exposures associated with our compensation policies, plans and practices, regarding both executive compensation and our compensation structure generally. In particular, our Compensation Committee, in conjunction with our President and Chief Executive Officer and other members of our management, as appropriate, reviews our incentive compensation arrangements to ensure these programs are consistent with applicable laws and regulations, including safety and soundness requirements, and do not encourage imprudent or excessive risk-taking by our employees. The Corporate Governance and Nominating Committee of our board of directors oversees risks associated with the independence of our board of directors and potential conflicts of interest.
Our senior management is responsible for implementing our risk management processes, including by assessing and managing the risks we face, including strategic, operational, regulatory, investment and execution risks, on a day-to-day basis, and reporting to our board of directors regarding our risk management processes. Our senior management is also responsible for creating and recommending to our board of directors for approval appropriate risk appetite metrics reflecting the aggregate
3
levels and types of risk we are willing to accept in connection with the operation of our business and pursuit of our business objectives.
The role of our board of directors in our risk oversight is consistent with our leadership structure, with our President, Chief Financial Officer and Chief Executive Officer, along with the other members of senior management having responsibility for assessing and managing our risk exposure, and our board of directors and its committees providing oversight in connection with those efforts. We believe this division of risk management responsibilities presents a consistent, systemic and effective approach for identifying, managing and mitigating risks throughout our operations.
Properties
Our principal executive office is located at 3333 Deposit Drive Northeast, Grand Rapids, Michigan 49546. In addition to our principal executive office, we operate loan production offices across 23 cities in 15 states that are supported through our centralized operating center in Grand Rapids, Michigan.
Human Capital
To facilitate talent attraction and retention, we strive to create an inclusive, safe and healthy workplace with opportunities for our employees to grow and develop in their careers, supported by strong compensation, benefits and health and welfare programs.
Employee Profile
As of December 31, 2024, we had 491 full-time employees and 9 part-time employees. None of our employees are covered by a collective bargaining agreement. We consider our relationship with our employees to be good and have not experienced interruptions of operations due to labor disagreements.
Compensation and Benefits
We provide a competitive compensation and benefits program to help meet the needs of our employees. In addition to salaries, these programs include annual bonus opportunities, a 401(k) plan with an employer matching contribution, healthcare and insurance benefits, flexible spending accounts, paid time off and family leave and an employee assistance program. Restricted stock awards are also available to certain employees.
Learning and Development
We invest in the growth and development of our employees by providing a multi-dimensional approach to learning that empowers, intellectually grows, and professionally develops our colleagues. In particular, we facilitate the educational and professional development of our employees through support to attend conferences and obtain degrees, licenses and certifications while employed by us.
Corporate Information
Our principal executive offices are located at 3333 Deposit Drive Northeast, Grand Rapids, Michigan 49546, and our telephone number at that address is (616) 940-9400. Our website address is www.northpointe.com. The information contained on our website is not a part of, or incorporated by reference into this Form 10-K.
Public Information
Persons interested in obtaining information on the Company may read and copy any materials that we file with the U.S. Securities and Exchange Commission ("SEC"). The Commission maintains an Internet site that contains reports, proxy and information statements, and other information regarding issuers that file electronically with the SEC at www.sec.gov. We make available, free of charge, on or through our website, https://ir.northpointe.com/, our Annual Reports on Form 10-K, Quarterly Reports on Form 10-Q, Current Reports on Form 8-K, and other filings pursuant to Section 13(a) or 15(d) of the Securities Exchange Act of 1934, and amendments to such filings, as soon as reasonably practicable after each is electronically filed with, or furnished to, the SEC.
Also available on the Company's website are its Code of Business Conduct and Ethics, Corporate Governance Guidelines, the charter of each active committee of the Board of Directors, and other materials outlining the Company's corporate governance practices.
4
SUPERVISION AND REGULATION
We are extensively regulated under federal and state law. The following is a brief summary that does not purport to be a complete description of all regulations that affect us or all aspects of those regulations. This discussion is qualified in its entirety by reference to the particular statutory and regulatory provisions described below and is not intended to be an exhaustive description of the statutes or regulations applicable to the Company’s and the Bank’s business. In addition, proposals to change the laws and regulations governing the banking industry are frequently raised at both the state and federal levels. The likelihood and timing of any changes in these laws and regulations, and the impact such changes may have on us and the Bank, are difficult to predict. Regulatory agencies may issue enforcement actions, policy statements, interpretive letters, and similar written guidance applicable to us or to the Bank. Changes in applicable laws, regulations, or regulatory guidance, or their interpretation by regulatory agencies or courts may have a material adverse effect on our and the Bank’s business, operations, and earnings.
We, the Bank, and in some cases, our nonbank affiliates, must undergo regular examinations by the appropriate regulatory agency, which will examine for adherence to a range of legal and regulatory compliance responsibilities. A bank regulator conducting an examination has complete access to the books and records of the examined institution. The results of the examination are confidential. Supervision and regulation of banks, their holding companies, and affiliates is intended primarily for the protection of depositors and clients, the DIFS of the FDIC, and the U.S. banking and financial system rather than holders of our securities.
Regulation of the Company
We are registered as a bank holding company with the Federal Reserve under the BHC Act. As such, we are subject to comprehensive supervision and regulation by the Federal Reserve and are subject to its regulatory reporting requirements. Federal law subjects bank holding companies, such as the Company, to restrictions on the types of activities in which they may engage, and to a range of supervisory requirements. Various federal and state bodies regulate and supervise our non-bank activities including our trust and insurance agency activities.
Violations of laws and regulations, or other unsafe and unsound practices, may result in regulatory agencies imposing fines or penalties, cease and desist orders, or taking other enforcement actions. Under certain circumstances, these agencies may enforce remedies directly against officers, directors, employees, and other parties participating in the affairs of a bank or bank holding company. Under federal and state laws and regulations pertaining to the safety and soundness of insured depository institutions, state banking regulators, the Federal Reserve, and separately the FDIC as the insurer of bank deposits have the authority to compel or restrict certain actions on our part if they determine that we have insufficient capital or other resources, or are otherwise operating in a manner that may be deemed to be inconsistent with safe and sound banking practices. Under this authority, our regulators can require us or our subsidiaries to enter into informal or formal supervisory agreements, including board resolutions, memoranda of understanding, written agreements, and consent or cease and desist orders pursuant to which we would be required to take identified corrective actions to address cited concerns and to refrain from taking certain actions.
If we become subject to and are unable to comply with the terms of any regulatory actions or directives, supervisory agreements or orders, then we could become subject to additional, heightened supervisory actions and orders, possibly including prompt corrective action restrictions and/or other regulatory actions, including prohibitions on the payment of dividends on our common stock and preferred stock. If our regulators were to take such supervisory actions, then we could, among other things, become subject to significant restrictions on our ability to develop any new business, as well as restrictions on our existing business, and we could be required to raise additional capital, dispose of certain assets and liabilities within a prescribed period of time, or both. The terms of any such action could have a material negative effect on our business, reputation, operating flexibility, financial condition, and the value of our common stock and preferred stock.
Activity Limitations
Bank holding companies are generally restricted to engaging in the business of banking, managing or controlling banks and certain other activities determined by the Federal Reserve to be closely related to banking. In addition, the Federal Reserve has the power to order a bank holding company or its subsidiaries to terminate any nonbanking activity or terminate its ownership or control of any nonbank subsidiary when it has reasonable cause to believe that continuation of such activity or such ownership or control constitutes a serious risk to the financial safety, soundness, or stability of any bank subsidiary of that bank holding company.
Source of Strength Obligations
A bank holding company, such as us, is required to act as a source of financial and managerial strength to its subsidiary bank. The term “source of financial strength” means the ability of a company, such as us, that directly or indirectly owns or controls an insured depository institution, such as the Bank, to provide financial assistance to such insured depository institution in the
5
event of financial distress. The appropriate federal banking agency for the depository institution (in the case of the Bank, this agency is the FDIC) may require reports from us to assess our ability to serve as a source of strength and to enforce compliance with the source of strength requirements by requiring us to provide financial assistance to the Bank in the event of financial distress. If we were to enter bankruptcy or become subject to the orderly liquidation process established by the Dodd-Frank Act, any commitment by us to a federal bank regulatory agency to maintain the capital of the Bank would be assumed by the bankruptcy trustee or the FDIC, as appropriate, and entitled to a priority of payment. In addition, the FDIC provides that any insured depository institution generally will be liable for any loss incurred by the FDIC in connection with the default of, or any assistance provided by the FDIC to, a commonly controlled insured depository institution. the Bank is an FDIC-insured depository institution and thus subject to these requirements.
Acquisitions
The BHC Act permits acquisitions of banks by bank holding companies, such that we and any other bank holding company, whether located in Michigan or elsewhere, may acquire a bank located in any other state, subject to certain deposit-percentage, age of bank charter requirements, and other restrictions. The BHC Act requires that a bank holding company obtain the prior approval of the Federal Reserve before (i) acquiring direct or indirect ownership or control of more than 5% of the voting shares of any additional bank or bank holding company, (ii) taking any action that causes an additional bank or bank holding company to become a subsidiary of the bank holding company, or (iii) merging or consolidating with any other bank holding company. The Federal Reserve may not approve any such transaction that would result in a monopoly or would be in furtherance of any combination or conspiracy to monopolize or attempt to monopolize the business of banking in any section of the United States, or the effect of which may be substantially to lessen competition or to tend to create a monopoly in any section of the country, or that in any other manner would be in restraint of trade unless the anticompetitive effects of the proposed transaction are clearly outweighed in the public interest by the probable effect of the transaction in meeting the convenience and needs of the community to be served. The Federal Reserve is also required to consider: (i) the financial and managerial resources of the companies involved, including pro forma capital ratios; (ii) the risk to the stability of the United States banking or financial system; (iii) the convenience and needs of the communities to be served, including performance under the CRA; and (iv) the effectiveness of the company in combating money laundering.
Change in Control
Federal law restricts the amount of voting stock of a bank holding company or a bank that a person may acquire without the prior approval of banking regulators. Under the Change in Bank Control Act and the regulations thereunder, a person or group must give advance notice to the Federal Reserve before acquiring control of any bank holding company, such as the Company, or to the appropriate regulator before acquiring control of any FDIC-insured bank, such as the Bank. Upon receipt of such notice, the regulator may approve or disapprove the acquisition. The Change in Bank Control Act creates a rebuttable presumption of control if a person or group acquires the power to vote 10% or more of our outstanding common stock. The overall effect of such laws is to make it more difficult to acquire a bank holding company and a bank by tender offer or similar means than it might be to acquire control of another type of corporation. Consequently, stockholders of the Company may be less likely to benefit from the rapid increases in stock prices that may result from tender offers or similar efforts to acquire control of other companies. Investors should be aware of these requirements when acquiring shares of our stock.
Repurchase or Redemption of Shares
A BHC is generally required to give the Federal Reserve prior written notice of any purchase or redemption of its own then-outstanding equity securities if the gross consideration for the purchase or redemption, when combined with the net consideration paid for all such purchases or redemptions during the preceding twelve months, is equal to 10.0% or more of the company’s consolidated net worth. The Federal Reserve may disapprove such a purchase or redemption if it determines that the proposal would constitute an unsafe and unsound practice, or would violate any law, regulation, Federal Reserve order or directive, or any condition imposed by, or written agreement with, the Federal Reserve. The Federal Reserve has adopted an exception to this approval requirement for BHCs that meet certain “well-capitalized” and “well-managed” standards and are not the subject of any unresolved supervisory issue.
Incentive Compensation
The Dodd-Frank Act required the federal banking agencies and the SEC to establish joint rules or guidelines for financial institutions with more than $1 billion in assets, such as us and the Bank, which prohibit incentive compensation arrangements that the agencies determine to encourage inappropriate risks by the institution. The federal banking agencies issued proposed rules in 2011 and previously issued guidance on sound incentive compensation policies. In 2016, the federal banking agencies and the SEC proposed rules that would, depending upon the assets of the institution, directly regulate incentive compensation arrangements and would require enhanced oversight and recordkeeping. As of December 31, 2024, these rules have not been implemented, although the SEC did adopt final rules implementing the clawback provisions of the Dodd-Frank Act in 2022. We
6
and the Bank have undertaken efforts to ensure that our incentive compensation plans do not encourage inappropriate risks, consistent with three key principles - that incentive compensation arrangements should appropriately balance risk and financial rewards, be compatible with effective controls and risk management, and be supported by strong corporate governance.
Capital Requirements
We and the Bank are required under federal law to maintain certain minimum capital levels based on ratios of capital to total assets and capital to risk-weighted assets. The required capital ratios are minimums, and the regulators may determine that a banking organization based on its size, complexity, or risk profile must maintain a higher level of capital in order to operate in a safe and sound manner. Risks such as concentration of credit risks and the risk arising from non-traditional activities, as well as the institution’s exposure to a decline in the economic value of its capital due to changes in interest rates, and an institution’s ability to manage those risks, are important factors that are to be taken into account in assessing an institution’s overall capital adequacy. The following is a brief description of the relevant provisions of these capital rules and their potential impact on our capital levels.
We and the Bank are subject to the following risk-based capital ratios: a CET1 risk-based capital ratio, a Tier 1 risk-based capital ratio, which includes CET1 and additional Tier 1 capital, and a total risk-based capital ratio, which includes Tier 1 and Tier 2 capital. CET1 is primarily comprised of the sum of common stock instruments and related surplus net of treasury stock plus retained earnings less certain adjustments and deductions, including with respect to goodwill, intangible assets, mortgage servicing assets, and deferred tax assets subject to temporary timing differences. Additional Tier 1 capital is primarily comprised of noncumulative perpetual preferred stock. Tier 2 capital consists of instruments disqualified from Tier 1 capital, including qualifying subordinated debt and a limited amount of loan loss reserves up to a maximum of 1.25% of risk-weighted assets, subject to certain eligibility criteria. The capital rules also define the risk-weights assigned to assets and off-balance sheet items to determine the risk-weighted asset components of the risk-based capital rules, including, for example, certain “high volatility” commercial real estate, past due assets, structured securities, and equity holdings.
The leverage capital ratio, which serves as a minimum capital standard, is the ratio of Tier 1 capital to quarterly average total consolidated assets net of goodwill, certain other intangible assets, and certain required deduction items. The required minimum leverage ratio for all banks and bank holding companies is 4%.
In addition, effective January 1, 2019, the capital rules required a capital conservation buffer of 2.5% above each of the minimum risk-based capital ratio requirements (CET1, Tier 1, and total capital), which is designed to absorb losses during periods of economic stress. These buffer requirements must be met for a bank or bank holding company to be able to pay dividends, engage in share buybacks, or make discretionary bonus payments to executive management without restriction.
The FDICIA, among other things, requires the federal bank regulatory agencies to take “prompt corrective action” regarding depository institutions that do not meet minimum capital requirements. FDICIA establishes five regulatory capital tiers: “well capitalized”, “adequately capitalized”, “undercapitalized”, “significantly undercapitalized”, and “critically undercapitalized”. A depository institution’s capital tier will depend upon how its capital levels compare to various relevant capital measures and certain other factors, as established by regulation. FDICIA generally prohibits a depository institution from making any capital distribution (including payment of a dividend) or paying any management fee to its holding company if the depository institution would thereafter be undercapitalized. The FDICIA imposes progressively more restrictive restraints on operations, management, and capital distributions depending on the category in which an institution is classified. Undercapitalized depository institutions are subject to restrictions on borrowing from the Federal Reserve System. In addition, undercapitalized depository institutions may not accept brokered deposits absent a waiver from the FDIC, are subject to growth limitations, and are required to submit capital restoration plans for regulatory approval. A depository institution's holding company must guarantee any required capital restoration plan up to an amount equal to the lesser of 5% of the depository institution's assets at the time it becomes undercapitalized or the amount of the capital deficiency when the institution fails to comply with the plan. Federal banking agencies may not accept a capital plan without determining, among other things, that the plan is based on realistic assumptions and is likely to succeed in restoring the depository institution's capital. If a depository institution fails to submit an acceptable plan, it is treated as if it is significantly undercapitalized.
To be well-capitalized, the Bank must maintain at least the following capital ratios:
•6.5% CET1 to risk-weighted assets;
•8.0% Tier 1 capital to risk-weighted assets;
•10.0% Total capital to risk-weighted assets; and
•5.0% leverage ratio.
7
The Federal Reserve has not yet revised the well-capitalized standard for bank holding companies to reflect the higher capital requirements imposed under the current capital rules applicable to banks. For purposes of the Federal Reserve’s Regulation Y, including determining whether a bank holding company meets the requirements to be a financial holding company, bank holding companies, such as the Company, must maintain a Tier 1 risk-based capital ratio of 6.0% or greater and a total risk-based capital ratio of 10.0% or greater to be well-capitalized. Also, the Federal Reserve may require bank holding companies, including the Company, to maintain capital ratios substantially in excess of mandated minimum levels depending upon general economic conditions and a bank holding company’s particular condition, risk profile, and growth plans.
Failure to be well-capitalized or to meet minimum capital requirements could result in certain mandatory and possible additional discretionary actions by regulators that, if undertaken, could have an adverse material effect on our operations or financial condition. Failure to meet minimum capital requirements could also result in restrictions on the Company’s or the Bank’s ability to pay dividends or otherwise distribute capital or to receive regulatory approval of applications or other restrictions on its growth.
As of December 31, 2024, the Company’s and the Bank’s regulatory capital ratios were above the applicable well-capitalized standards and met the capital conservation buffer. Based on current estimates, we believe that the Company and the Bank will continue to exceed all applicable well-capitalized regulatory capital requirements and the capital conservation buffer in 2025.
Additional information on our capital ratios may be found in Item 7 of this report under the heading "Capital Resources" included in "Management’s Discussion and Analysis of Results of Operations and Financial Condition" and in Item 8 of this report in the Notes to the Consolidated Financial Statements.
Payment of Dividends
We are a legal entity separate and distinct from the Bank and our other subsidiaries. The primary sources of funds for our payment of dividends to our stockholders are cash on hand and dividends from the Bank and our non-bank subsidiaries. Various federal and state statutory provisions and regulations limit the amount of dividends that the Bank may pay. Under Michigan law, banks may not declare dividends out of capital or surplus. The Bank may only declare dividends on its common stock out of net income on hand, after deducting losses and bad debts, and provided the bank will have a surplus of 20.0% or more of its capital after payment of the proposed dividend. Moreover, a bank must transfer to surplus at least 10.0% of its net income (a) for the prior six months, in the case of quarterly or semiannual dividends or (b) for the two prior six-month periods, in the case of annual dividends.
In addition, we and the Bank are subject to various general regulatory policies and requirements relating to the payment of dividends, including requirements to maintain adequate capital above regulatory minimums. The FDIC has indicated that paying dividends that deplete a bank’s capital base to an inadequate level would be an unsafe and unsound banking practice. The Federal Reserve has indicated that holding companies should generally pay dividends only out of current operating earnings.
Under a Federal Reserve policy adopted in 2009, the board of directors of a bank holding company must consider different factors to ensure that its dividend level is prudent relative to maintaining a strong financial position and is not based on overly optimistic earnings scenarios, such as potential events that could affect its ability to pay, while still maintaining a strong financial position. As a general matter, the Federal Reserve has indicated that the board of directors of a bank holding company should consult with the Federal Reserve and eliminate, defer, or significantly reduce the bank holding company’s dividends if:
•its net income available to stockholders for the past four quarters, net of dividends previously paid during that period, is not sufficient to fully fund the dividends;
•its prospective rate of earnings retention is not consistent with its capital needs and overall current and prospective financial condition; or
•it will not meet, or is in danger of not meeting, its minimum regulatory capital adequacy ratios.
Additional information about restrictions on payment of dividends by the Bank may be found in Item 8 of this report in Notes 1 and 17 to the Consolidated Financial Statements.
8
Regulation of the Bank
The Bank is subject to comprehensive supervision and regulation by the FDIC, and is subject to its regulatory reporting requirements, as well as supervision and regulation by the DIFS.
Broadly, regulations applicable to the Bank include limitations on loans to a single borrower and to its directors, officers, and employees; restrictions on the opening and closing of branch offices; the maintenance of required capital ratios; the granting of credit under equal and fair conditions; the disclosure of the costs and terms of such credit; requirements to maintain reserves against deposits and loans; limitations on the types of investment that may be made by the Bank; and requirements governing risk management practices. Subject to FDIC approval and certain state filing requirements, the Bank is permitted under federal law to branch on a de novo basis across state lines wherever the laws of that state would permit a bank chartered by that state to establish a branch.
Transactions with Affiliates and Insiders
The Bank is subject to restrictions on extensions of credit and certain other transactions between the Bank and the Company or any nonbank affiliate as defined. Generally, these covered transactions with either the Company or any affiliate are limited to 10% of the Bank’s capital and surplus, and all such transactions between the Bank and the Company and all of its nonbank affiliates combined are limited to 20% of the Bank’s capital and surplus. Loans and other extensions of credit from the Bank to the Company or any affiliate generally are required to be secured by eligible collateral in specified amounts. In addition, any transaction between the Bank and the Company or any affiliate are required to be on an arm’s length basis. Federal banking laws also place similar restrictions on certain extensions of credit by insured banks, such as the Bank, to their directors, executive officers, and principal stockholders.
FDIC Insurance Assessments and Depositor Preference
The Bank’s deposits are insured by the FDIC’s DIF up to the limits under applicable law, which currently are set at $250,000 per depositor, per insured bank, for each account ownership category. The Bank is subject to FDIC assessments for its deposit insurance. The FDIC calculates quarterly deposit insurance assessments based on an institution’s average total consolidated assets less its average tangible equity and applies one of four risk categories determined by reference to its capital levels, supervisory ratings, and certain other factors. The assessment rate schedule can change from time to time, at the discretion of the FDIC, subject to certain limits.
As of June 30, 2020, the DIF reserve ratio fell to 1.30%, below the statutory minimum of 1.35%. The FDIC, as required under the Federal Deposit Insurance Act, established a plan on September 15, 2020 to restore the DIF reserve ratio to meet or exceed the statutory minimum of 1.35% within eight years. On October 18, 2022, the FDIC adopted an amended restoration plan to increase the likelihood that the reserve ratio would be restored to at least 1.35% by September 30, 2028. The FDIC's amended restoration plan increases the initial base deposit insurance assessment rate schedules uniformly by 2 bps, beginning in the first quarterly assessment period of 2023. The FDIC could further increase the deposit insurance assessments for certain insured depository institutions, including the Bank, if the DIF reserve ratio is not restored as projected.
In November 2023, the FDIC approved a final rule to implement a special assessment to recover the loss to the DIF associated with several bank failures that occurred during early 2023. The assessment base for the special assessment is equal to estimated uninsured deposits reported as of December 31, 2022, adjusted to exclude the first $5 billion, to be collected at an annual rate of approximately 13.4 basis points for an anticipated total of eight quarterly assessment periods, beginning the first quarterly assessment period of 2024. We estimate our annual assessment rate to be 13 basis points in 2025.
Insurance of deposits may be terminated by the FDIC upon a finding that the institution has engaged in unsafe and unsound practices, is in an unsafe or unsound condition to continue operations, or has violated any applicable law, regulation, rule, order or condition imposed by a bank’s federal regulatory agency. In addition, the Federal Deposit Insurance Act provides that, in the event of the liquidation or other resolution of an insured depository institution, the claims of depositors of the institution, including the claims of the FDIC as subrogee of insured depositors, and certain claims for administrative expenses of the FDIC as a receiver, will have priority over other general unsecured claims against the institution, including those of the parent bank holding company.
Standards for Safety and Soundness
The Federal Deposit Insurance Act requires the federal bank regulatory agencies to prescribe, by regulation or guideline, operational and managerial standards for all insured depository institutions relating to: (i) internal controls; (ii) information systems and audit systems; (iii) loan documentation; (iv) credit underwriting; (v) interest rate risk exposure; and (vi) asset quality. The federal banking agencies have adopted regulations and Interagency Guidelines Establishing Standards for Safety
9
and Soundness to implement these required standards. These guidelines set forth the safety and soundness standards used to identify and address problems at insured depository institutions before capital becomes impaired. Under the regulations, if a regulator determines that a bank fails to meet any standards prescribed by the guidelines, the regulator may require the bank to submit an acceptable plan to achieve compliance, consistent with deadlines for the submission and review of such safety and soundness compliance plans.
Anti-Money Laundering
A continued focus of governmental policy relating to financial institutions in recent years has been combating money laundering and terrorist financing. The USA PATRIOT Act broadened the application of anti-money laundering regulations to apply to additional types of financial institutions such as broker-dealers, investment advisors, and insurance companies, and strengthened the ability of the U.S. government to help prevent, detect and prosecute international money laundering and the financing of terrorism. The principal provisions of Title III of the USA PATRIOT Act require that regulated financial institutions, including state banks: (i) establish an anti-money laundering program that includes training and audit components; (ii) comply with regulations regarding the verification of the identity of any person seeking to open an account; (iii) take additional required precautions with non-U.S. owned accounts; and (iv) perform certain verification and certification of money laundering risk for their foreign correspondent banking relationships. Failure of a financial institution to comply with the USA PATRIOT Act’s requirements could have serious legal and reputational consequences for the institution. The Bank has augmented its systems and procedures to meet the requirements of these regulations and will continue to revise and update its policies, procedures, and controls to reflect changes required by law.
FinCEN has adopted rules that require financial institutions to obtain beneficial ownership information with respect to legal entities with which such institutions conduct business, subject to certain exclusions and exemptions. Bank regulators are focusing their examinations on anti-money laundering compliance, and we continue to monitor and augment, where necessary, our anti-money laundering compliance programs. Banking regulators will consider compliance with the USA PATRIOT Act’s money laundering provisions in acting upon merger and acquisition proposals. Bank regulators routinely examine institutions for compliance with these obligations and have been active in imposing cease and desist and other regulatory orders and civil money penalties against institutions found to be violating these obligations. Sanctions for violations of the USA PATRIOT Act can be imposed in an amount equal to twice the sum involved in the violating transaction, up to $1 million.
Economic Sanctions
The OFAC is responsible for helping to ensure that U.S. entities do not engage in transactions with certain prohibited parties, as defined by various executive orders and acts of Congress. OFAC publishes, and routinely updates, lists of names of persons and organizations suspected of aiding, harboring, or engaging in terrorist acts, including the Specially Designated Nationals and Blocked Persons List. If we find a name on any transaction, account, or wire transfer that is on an OFAC list, we must undertake certain specified activities, which could include blocking or freezing the account or transaction requested, and we must notify the appropriate authorities.
Concentrations in Lending
During 2006, the federal bank regulatory agencies released guidance on “Concentrations in Commercial Real Estate Lending” (the “Guidance”) and advised financial institutions of the risks posed by CRE lending concentrations. The Guidance requires that appropriate processes be in place to identify, monitor, and control risks associated with real estate lending concentrations. Higher allowances for loan losses and capital levels may also be required. The Guidance is triggered when CRE loan concentrations exceed either:
•total reported loans for construction, land development, and other land of 100% or more of a bank’s total risk-based capital; or
•total reported loans secured by multifamily and nonfarm nonresidential properties and loans for construction, land development, and other land of 300% or more of a bank’s total risk-based capital.
The Guidance also applies when a bank has a sharp increase in CRE loans or has significant concentrations of CRE secured by a particular property type. We have always had exposures to loans secured by CRE due to the nature of our markets and the borrowing needs of both consumer and commercial clients. We believe our long-term experience in CRE lending, underwriting policies, internal controls, and other policies currently in place, as well as our loan and credit monitoring and administration procedures, are generally appropriate in managing our concentrations as required under the Guidance.
10
Community Reinvestment Act
The Bank is subject to the provisions of the CRA, which imposes a continuing and affirmative obligation, consistent with safe and sound operation, to help meet the credit needs of entire communities where the bank accepts deposits, including low- and moderate-income neighborhoods. The FDIC’s assessment of the Bank’s CRA record is made available to the public. CRA agreements with private parties must be disclosed and annual CRA reports must be made to the FDIC. Federal CRA regulations require, among other things, that evidence of discrimination against applicants on a prohibited basis and illegal or abusive lending practices be considered in the CRA evaluation. The Bank has a rating of “Satisfactory” in its most recent CRA evaluation.
On October 24, 2023, the Office of the Comptroller of the Currency (“OCC”), Federal Reserve, and FDIC issued a final rule to modernize their respective CRA regulations. The revised rules substantially alter the methodology for assessing compliance with the CRA, with material aspects taking effect January 1, 2026 and revised data reporting requirements taking effect January 1, 2027. Among other things, the revised rules evaluate lending outside traditional assessment areas generated by the growth of non-branch delivery systems, such as online and mobile banking, apply a metrics-based benchmarking approach to assessment, and clarify eligible CRA activities. The revised CRA regulations have been subject to an injunction since March 29, 2024. The effective dates will be extended for each day the injunction remains in place, pending the resolution of the lawsuit.
Anti-Tying Restrictions
In general, a bank may not extend credit, lease, sell property, or furnish any services or fix or vary the consideration for them on the condition that (i) the client obtain or provide some additional credit, property, or services from or to the bank or bank holding company or their subsidiaries or (ii) the client not obtain some other credit, property, or services from a competitor, except to the extent reasonable conditions are imposed to assure the soundness of the credit extended. A bank may, however, offer combined-balance products and may otherwise offer more favorable terms if a client obtains two or more traditional bank products. The law also expressly permits banks to engage in other forms of tying and authorizes the Federal Reserve Board to grant additional exceptions by regulation or order. Also, certain foreign transactions are exempt from the general rule.
Consumer Financial Services
The structure of federal consumer protection regulation applicable to all providers of consumer financial products and services changed significantly on July 21, 2011, when the CFPB commenced operations to oversee and enforce consumer protection laws. The CFPB has broad rulemaking authority for a wide range of consumer protection laws that apply to all providers of consumer products and services, including our Bank, as well as the authority to prohibit “unfair, deceptive or abusive” acts and practices. The CFPB has examination and enforcement authority over insured depository institutions and their holding companies with more than $10 billion in assets. (The CFPB has similar authority over certain nonbanking organizations.) Banks and savings institutions with $10 billion or less in assets, like our Bank, will continue to be examined by their primary federal regulators, which can be expected to nonetheless look to the rulings and enforcement actions of the CFPB as they carry out their supervision of larger institutions.
Because abuses in connection with residential mortgages were a significant factor contributing to the financial crisis, many new rules issued by the CFPB and required by the Dodd-Frank Act address mortgage and mortgage-related products, their underwriting, origination, servicing and sales. The Dodd-Frank Act significantly expanded underwriting requirements applicable to loans secured by 1-4 family residential real property and augmented federal law combating predatory lending practices. In addition to numerous disclosure requirements, the Dodd-Frank Act imposed new standards for mortgage loan originations on all lenders, including banks and savings associations, in an effort to strongly encourage lenders to verify a borrower’s ability to repay, while also establishing a presumption of compliance for certain “qualified mortgages.” In addition, the Dodd-Frank Act generally required lenders or securitizers to retain an economic interest in the credit risk relating to loans that the lender sells, and other asset-backed securities that the securitizer issues, if the loans do not comply with the ability-to-repay standards described below. The risk retention requirement generally is 5.0%, but the statute and its implementing regulations, exempt certain transactions from the requirement. The CFPB’s rules have impacted our operations, and have resulted in higher compliance costs for the Bank.
Consumer Laws
Numerous federal, state and local consumer protection laws impose substantive requirements upon mortgage lenders, servicers and holders of mortgage loans in connection with the origination, servicing and enforcement of mortgage loans.
The Bank must comply with many federal laws including:
11
•the Truth in Lending Act (“TILA”) and Regulation Z promulgated thereunder, which (among other things) require specific disclosures to the borrowers regarding the terms of the mortgage loans and inclusion of certain terms in an originator’s underwriting guidelines;
•the Consumer Financial Protection Act, enacted as part of the Dodd-Frank Act, which (among other things) created the CFPB and gave it broad rulemaking, supervisory and enforcement jurisdiction over mortgage lenders and servicers, and proscribes any unfair, deceptive or abusive acts or practices in connection with any consumer financial product or services;
•the Equal Credit Opportunity Act and Regulation B promulgated thereunder, which (among other things) prohibit discrimination on the basis of age, race, color, sex, religion, marital status, national origin, receipt of public assistance or the exercise of any right under the Consumer Credit Protection Act, in the extension of credit; and
•the Fair Credit Reporting Act, as amended by the Fair and Accurate Transactions Act, which (among other things) regulates the use and reporting of information related to the borrower’s credit experience.
Other federal laws also may apply, including but not limited to the, Alternative Mortgage Transactions Parity Act, BSA, Electronic Funds Transfer Act, Fair Debt Collection Practices Act, Fair Housing Act, Federal Trade Commission Act, Flood Disaster Protection Act of 1998, Gramm-Leach-Bliley Act, Home Mortgage Disclosure Act, Real Estate Settlement Procedures Act (“RESPA”), Right to Financial Privacy Act, SAFE Mortgage Licensing Act, and the Servicemembers Civil Relief Act.
Our mortgage lending activities are also subject to applicable state and local laws that regulate among other things, interest rates and other charges, require specific disclosure, regulate specific practices and require licensing of various participants in the transaction. In addition, other state and local laws, public policy and general principles of equity relating to the protection of consumers, unfair and deceptive practices and debt collection practices may apply to the origination, ownership, servicing or collection of mortgage loans.
The CFPB, state and federal banking regulatory agencies, state attorneys general offices, the Federal Trade Commission, the U.S. Department of Justice, the U.S. Department of Housing and Urban Development and state and local governmental authorities continue to monitor lending practices. State, local and federal governmental agencies have imposed sanctions on originators for practices including, but not limited to, charging borrowers excessive fees, steering borrowers to loans with higher costs or more onerous terms, imposing higher interest rates than the borrower’s credit risk warrants, failing to adequately disclose the material terms of loans to the borrowers and otherwise engaging in discriminatory lending practices or unfair, deceptive or abusive acts or practices.
S.A.F.E. Act
Regulations issued under the Secure and Fair Enforcement for Mortgage Licensing Act of 2008 (the “S.A.F.E. Act”) require residential mortgage loan originators who are employees of institutions regulated by the foregoing agencies to meet the registration requirements of the S.A.F.E. Act. The S.A.F.E. Act requires residential mortgage loan originators who are employees of regulated financial institutions to register with the Nationwide Mortgage Licensing System and Registry, a database created by the Conference of State Bank Supervisors and the American Association of Residential Mortgage Regulators to support the licensing of mortgage loan originators by the states. The S.A.F.E. Act generally prohibits employees of regulated financial institutions from originating residential mortgage loans unless they obtain and annually maintain registration as a registered mortgage loan originator.
The Bank conducts all its mortgage origination and warehouse alternative finance activities directly from our Bank itself, and is exempt from most state, but not all, licensing requirements by virtue of being a state-chartered bank. The Bank is licensed to originate and service loans in Maine, Maryland, New Mexico and Utah, and has filed an exemption registration in Nevada. Other states may require our Bank to obtain mortgage or servicer licenses in their respective jurisdictions.
Loan Originator Compensation
On January 20, 2013, the CFPB issued a final rule under the Truth in Lending Act (Regulation Z) which imposed several requirements and restrictions on the compensation of mortgage loan originators. These compensation rules are intended to prevent originators from steering consumers into higher cost mortgages.
The California Homeowner Bill of Rights
The California Homeowner Bill of Rights, which became effective on January 1, 2013 and was amended effective January 1, 2019, among other measures (i) prohibits “dual track” foreclosures (servicers will be required to halt the foreclosure process while any modification is being considered), (ii) creates a single point of contact for homeowners while negotiating a loan modification, (iii) expands upon notice requirements to a borrower before taking action on a loan modification application or
12
pursuing foreclosure and (iv) allows for injunctions against foreclosure until violations are corrected and permits civil penalties (including monetary damages) against servicers that file multiple inaccurate mortgage documents or otherwise violate California law. The California Homeowner Bill of Rights is likely to extend foreclosure times in California and lead to increased litigation of the foreclosure process.
Homeowner Association Super Priority Liens May Take Priority Over the Mortgage Liens
In some states it is possible that the first lien of the mortgages may be extinguished by super priority liens of homeowner associations (“HOA”), potentially resulting in a loss of the mortgage loan’s outstanding principal balance. In at least 20 states, and the District of Columbia, HOA or condominium association assessment liens can take priority over first lien mortgages under certain circumstances. The number of these so called “super lien” states has increased in the past few decades and may increase further. Rulings by the highest courts of Nevada and the District of Columbia have held that the “super lien statute” provides the HOA or condominium association with a true lien priority rather than a payment priority from the proceeds of the sale, creating the ability to extinguish the senior mortgage and greatly increasing the risk of losses on mortgage loans secured by homes whose owners fail to pay HOA or condominium fees.
The laws of these “super lien” states that provide for HOA super liens vary in terms of (a) the duration of the priority period (with many at six months and some with no limitations); (b) the assessments secured by the HOA lien (charges can include not only unpaid HOA assessments, but also late charges, collection costs, attorneys’ fees, foreclosure costs, fines, and interest); (c) whether the HOA must give lenders with liens encumbering the mortgaged property notice of the homeowner’s failure to pay the assessment; and (d) the statute of limitations on HOA foreclosure rights.
Predatory Lending Laws/High Cost Loans
Various federal, state and local laws have been enacted to discourage predatory lending practices. The federal Home Ownership and Equity Protection Act of 1994, commonly known as HOEPA, amends TILA to prohibit inclusion of certain provisions in mortgage loans that have mortgage rates or origination costs in excess of prescribed levels, and require that borrowers be given certain disclosures prior to the origination of mortgage loans. Some states have enacted, similar laws or regulations, which in some cases impose restrictions and requirements greater than those in HOEPA.
In addition, under federal law and the anti-predatory lending laws of some states, the origination of certain mortgage loans (including loans that are not classified as “high cost” loans under applicable law) must satisfy a net tangible benefits test with respect to the related borrower. This test may be highly subjective and open to interpretation. As a result, a court may determine that a mortgage loan does not meet the test even if the related originator reasonably believed that the test was satisfied,
Failure to comply with these laws, to the extent applicable to any of the mortgage loans, could subject the originator and its assignees to monetary penalties and could result in the voiding or rescission of the affected mortgage loans. Lawsuits have been brought in various states making claims against assignees of high-cost loans for violations of state law. Named defendants in these cases have included numerous participants within the secondary mortgage market, including some securitization trusts.
All of the Mortgage Loans Originated by our Bank Are Subject to the “Know Before You Owe” TRID Disclosures
All of our mortgage loans are subject to the CFPB’s Know Before You Owe TRID rule, which became effective for mortgage loans whose applications were received on or after October 3, 2015. The purpose of the TRID rule was to reconcile overlapping disclosure obligations under TILA and RESPA and to provide for integrated closing disclosure and loan estimate forms that would satisfy those requirements under both TILA and RESPA.
Regular instances of potential non-compliance with the TRID rule have been reported in the marketplace since it became effective. Certain TILA-based disclosure provisions of the TRID rule carry assignee liability. Violations of TILA-based disclosure provisions of the TRID rule are limited in individual actions to actual damages, statutory damages for certain violations of not more than $4,000 per mortgage loan plus attorney’s fees and court costs, and can potentially result in liability for assignees where the violation is apparent on the face of the disclosure and the assignment was voluntary. While the statute of limitations under TILA is generally one year from the date of origination for most TRID violations, mortgagors may raise a violation of the TRID rules as a matter of defense by recoupment or set-off to an action to collect the debt beyond the one-year period, if permitted by state law. Further, for certain mortgage loans, while not changed by TRID requirements, TILA’s right of rescission may be extended to three years from consummation if there are errors in certain “material disclosures” such as the required disclosures of finance charges and payment schedule, which are contained within the TRID closing disclosure.
13
Risks Associated with Ability to Repay Laws
TILA provides that subsequent purchasers of mortgage loans originated in violation of certain requirements specified in TILA that require lenders to consider consumers’ “ability to repay” before extending them credit may have liability for such violations. The CFPB issued implementing regulations, which became effective January 10, 2014 for mortgage loans for which the application from the related mortgagor was taken on or after January 10, 2014, specifying the standards for a “qualified mortgage” that would have the benefit of a safe harbor from such liability if certain requirements are satisfied, or a rebuttable presumption of compliance with respect to such liability if certain requirements are satisfied and the annual percentage rate of the loan exceeds certain thresholds. The regulations apply to mortgage loans made for a personal, family, or household purpose secured by a one-to-four unit dwelling for which the application from the related mortgagor was taken on or after January 10, 2014.
Revised QM Rules
On December 10, 2020, the CFPB, issued the revised qualified mortgage rules (the “QM Rules”) that replaced Appendix Q and the strict 43.0% debt-to-income ratio (“DTI”) underwriting threshold with a priced-based “Qualified Mortgage Loan” definition. The revised QM Rules also terminated the “QM Patch,” under which certain loans eligible for purchase by Fannie Mae and Freddie Mac do not have to be underwritten to Appendix Q or satisfy the capped 43.0% DTI requirement. In order to qualify for QM status, the mortgage loan must continue to meet the statutory requirements regarding the 3.0% points and fees limits, and must not contain negative amortization, a balloon payment (except in the existing limited circumstances), or a term exceeding 30 years. Compliance with the revised QM rules became mandatory on October 1, 2022.
On the same day, the CFPB also issued a final “Seasoned QM” rulemaking that creates a pathway to “safe harbor” Qualified Mortgage (“QM”) status for performing non-QM and “rebuttable presumption” QM first lien loans that meet certain performance criteria portfolio requirements over a seasoning period of at least 36 months and that satisfy certain product restrictions, points and fees limits, and underwriting requirements prior to consummation. The “Seasoned QM” rule became effective with respect to applications received on or after March 1, 2021.
Under the revised QM rules, for first-lien transactions, a loan receives a conclusive presumption that the consumer had the ability to repay (and hence receives the safe harbor presumption of QM compliance) if the annual percentage rate does not exceed the average prime offer rate (“APOR”) for a comparable transaction by 1.5 percentage points or more as of the date the interest rate is set. A first-lien loan receives a “rebuttable presumption” that the consumer had the ability to repay if the APR exceeds the APOR for a comparable transaction by 1.5 percentage points or more but by less than 2.25 percentage points. The revised QM rules provide for higher thresholds for loans with smaller loan amounts, for subordinate-lien transactions, and for certain manufactured housing loans.
To qualify for QM status, the mortgage loan must continue to meet the statutory requirements regarding the 3.0% points and fees limits, and it must not contain negative amortization, a balloon payment (except in the existing limited circumstances), or a term exceeding 30 years.
CFPB Mortgage Servicing Rules
In February 2012, the Department of Justice, the Department of Housing and Urban Development and 49 States’ Attorneys General reached a settlement with five leading bank mortgage servicers that requires those servicers to implement comprehensive reforms to their mortgage servicing practices. Consent judgments implementing the agreement were filed in the U.S. District Court in Washington, D.C. in March 2012. The servicing standards outlined in the settlement agreement include (i) preventing mortgage servicers from engaging in robo-signing and other improper foreclosure practices, (ii) requiring servicers to offer loss mitigation alternatives to borrowers before pursuing foreclosure, (iii) increasing the transparency of the loss mitigation process, (iv) imposing timelines for servicers to respond to borrowers and (v) restricting the practice of “dual tracking,” where foreclosure is initiated despite the borrower’s engagement in a loss mitigation process.
The CFPB Servicing Rules, among other things, incorporate many of the provisions of the servicing settlement discussed above, targets early intervention with borrowers following initial delinquency and imposes detailed requirements applicable in each step of the Servicer’s loss mitigation process. These rules, for example, prohibit the Servicer from commencing a foreclosure until a mortgage loan is more than 120 days delinquent and require the Servicer to provide certain notices and follow specific procedures relating to loss mitigation and foreclosure alternatives. The CFPB Servicing Rules therefore could result in increased delays in foreclosure or the inability to foreclose, which could in turn result in delays in payments on, or losses in respect of, the mortgage loans originated by our Bank.
14
On August 4, 2016, the CFPB announced amendments to certain of the CFPB Servicing Rules (“2016 Final Servicing Rule Amendments”) relating to force-placed insurance notices, delinquency and early intervention, loss mitigation, periodic monthly statements, and successors-in-interest to borrowers that could further impact servicing and delay foreclosures. Portions of the 2016 Final Servicing Rule Amendments became effective on August 19, 2017, and the remaining provisions became effective on April 19, 2018. On March 8, 2018, the CFPB issued a final rulemaking to amend certain sections of the 2016 Final Servicing Rule Amendments relating to the timing for servicers providing periodic statements and coupon books in connection with borrowers’ bankruptcy cases. As with the 2016 Final Servicing Rule Amendments, this final rule became effective on April 19, 2018. The 2016 Final Servicing Rule Amendments could result in increased delays in foreclosure or the inability to foreclose, which could in turn result in delays in payments on, or losses in respect of, the mortgage loans originated by our Bank.
On October 30, 2020, the CFPB issued a final rule to restate and clarify prohibitions on harassment and abuse, false or misleading representations, and unfair practices by debt collectors when collecting consumer debt. The rule focuses on debt collection communications and gives consumers more control over how often and through what means debt collectors can communicate with them regarding their debts. The rule also clarifies how the protections of the Fair Debt Collection Practices Act, which was passed in 1977, apply to newer communication technologies, such as email and text messages.
The final rule also contains provisions on disputes, and record retention, among other topics. The rule took effect on November 21, 2020. The CFPB issued a second debt collection final rule focused on consumer disclosures in December 2020. The second rule, issued in December 2020, clarifies disclosures debt collectors must provide to consumers at the beginning of collection communications. The second rule also prohibits debt collectors from suing or threatening to sue consumers on time barred debt. Additionally, the second rule requires debt collectors to take specific steps to disclose the existence of a debt to consumers before reporting information about the debt to a consumer reporting agency. Both rules took effect on November 30, 2021.
On July 10, 2024, the CFPB proposed a rule to amend provisions of the CFPB Servicing Rules to significantly revamp requirements relating to borrowers experiencing payment difficulties (the “Proposed Rule”). The Proposed Rule includes a number of key changes to the servicing requirements in Regulation X (12 C.F.R. Part 1024), and would streamline existing requirements when borrowers seek payment assistance in times of distress, add safeguards when borrowers seek help, and revise existing requirements with respect to borrower assistance. The Proposed Rule would also require servicers to provide certain communications in languages other than English, such as when a borrower is seeking payment assistance with their mortgage. While many of the key concepts were anticipated by the industry, the proposed provisions go much further than expected. The CFPB accepted comments on the Proposed Rule through September 9, 2024.
Privacy, Credit Reporting, and Data Security
The GLB generally prohibits disclosure of non-public consumer information to non-affiliated third parties unless the consumer has been given the opportunity to object and has not objected to such disclosure. Financial institutions are further required to disclose their privacy policies to clients annually. Financial institutions, however, will be required to comply with state law if it is more protective of consumer privacy than the GLB. The GLB also directed federal regulators to prescribe standards for the security of consumer information. The Bank is subject to such standards, as well as standards for notifying clients in the event of a security breach. The Bank utilizes credit bureau data in underwriting activities. Use of such data is regulated under the Fair Credit Reporting Act and Regulation V on a uniform, nationwide basis, including credit reporting, prescreening, and sharing of information between affiliates and the use of credit data. The Fair and Accurate Credit Transactions Act, which amended the Fair Credit Reporting Act, permits states to enact identity theft laws that are not inconsistent with the conduct required by the provisions of that Act. Clients must be notified when unauthorized disclosure involves sensitive client information that may be misused. On November 18, 2021, the federal banking agencies issued a new rule effective in 2022 that requires banks to notify their primary federal regulator within 36 hours of a “computer-security incident” that rises to the level of a “notification incident.”
The federal banking regulators regularly issue guidance regarding cybersecurity intended to enhance cyber risk management standards among financial institutions. As a result, financial institutions, like us and the Bank, are expected to establish multiple lines of defense and to ensure their risk management processes address the risk posed by potential threats to the institution. A financial institution’s management is expected to maintain sufficient processes to effectively respond and recover the institution’s operations after a cyber-attack. A financial institution is also expected to develop appropriate processes to enable recovery of data and business operations if a critical service provider of the institution falls victim to this type of cyber-attack. Our information security protocols are designed in part to adhere to the requirements of this guidance.
15
State regulators have also been increasingly active in implementing privacy and cybersecurity standards and regulations. Recently, several states have adopted regulations requiring certain financial institutions to implement cybersecurity programs and providing detailed requirements with respect to these programs, including data encryption requirements. Many states have also recently implemented or modified their data breach notification and data privacy requirements. We expect this trend of state-level activity in those areas to continue and are continually monitoring developments in the states in which our clients are located.
16
Item 1A. Risk Factors
An investment in our common stock involves a significant degree of risk. The material risks and uncertainties that management believes affect us are described below. Before you decide to invest in our common stock, you should carefully read and consider the risk factors described below as well as the other information included in this Form 10-K, including our consolidated financial statements and the related notes included elsewhere in this Form 10-K. Any of these risks, if they are realized, could have an adverse effect on our business, financial condition and results of operations, and consequently, the value of our common stock. In any such case, you could lose all or a portion of your original investment. Further, additional risks and uncertainties not currently known to us or that we currently believe to be immaterial may also adversely affect us.
Summary of Risk Factors
The following is a summary of the most significant risks and uncertainties that management believes could adversely affect the business, financial condition or results of operations. In addition to the following summary, you should consider the other information set forth in this “Risk Factors” section and the other information contained in this report before investing in the Company’s securities.
Risks related to our business
•Decreased residential mortgage origination, competition, and changes in interest rates may adversely affect our profitability
•Our mortgage banking profitability could significantly decline if we are not able to originate and resell a high volume of mortgage loans
•A decline in our MPP business could have a significant impact on our results of operations
•Because a significant portion of our loan portfolio is comprised of real estate loans, negative changes in the economy affecting real estate values and liquidity could impair the value of collateral securing our real estate loans and result in loan and other losses
•A decline in general business and economic conditions and any regulatory responses to such conditions could have a material adverse effect on our business, financial position, results of operations and growth prospects
•Liquidity risks could affect operations and jeopardize our business, financial condition, and results of operations, and deposits, many of which are brokered deposits, are our primary source of funding
•Fluctuations in interest rates may reduce net interest income and otherwise negatively impact our financial condition and results of operations
•If we do not effectively manage our credit risk, we may experience increased levels of delinquencies, nonperforming loans and charge-offs, which could require increases in our allowance for credit losses
•We may be required to repurchase or substitute mortgage loans or mortgage servicing rights (“MSRs”) that we have sold, or indemnify purchasers of our mortgage loans or MSRs
•We engage in lending secured by real estate and may be forced to foreclose on the collateral and own the underlying real estate, subjecting us to the costs and potential risks associated with the ownership of real property, or consumer protection initiatives or changes in state or federal law may substantially raise the cost of foreclosure or prevent us from foreclosing at all
•Our allowance for credit losses may prove to be insufficient to absorb actual losses in our loan portfolio
•Technology disruptions or failures, including a failure in our operational or security systems or infrastructure, or those of third parties with whom we do business, could disrupt our business, cause legal or reputational harm and adversely impact our financial condition and results of operations
•Cyberattacks and other data and security breaches could result in serious harm to our reputation and adversely affect our business
•We may not be able to make technological improvements as quickly as demanded by our customers, which could harm our ability to attract customers and adversely affect our financial condition, results of operations, and liquidity
•We depend on our ability to sell loans in the secondary market to a limited number of investors and to the GSEs, and to securitize our loans into MBS through the GSEs. If our ability to sell or securitize mortgage loans is impaired, whether as a result of regulatory action or otherwise, the volume of mortgage loans that we are able to originate will be reduced
17
•We are subject to certain operational risks, including, but not limited to, customer or employee fraud and data processing system failures and errors
•We qualify as an “emerging growth company” and have elected to take advantage of the scaled disclosures and other relief under the JOBS Act, and may take advantage of some or all of the reduced regulatory and reporting requirements that will be available to us under the JOBS Act
•Litigation and regulatory actions, including possible enforcement actions, could subject us to significant fines, penalties, judgments or other requirements resulting in increased expenses or restrictions on our business activities
•Severe weather, natural disasters, pandemics, acts of war or terrorism or other external events could significantly impact our business
Risks related to our industry and regulation
•Our industry is highly regulated, and the regulatory framework, together with any future legislative or regulatory changes, may have a materially adverse effect on our operations
•Federal and state regulators periodically examine our business and may require us to remediate adverse examination findings or may take enforcement action against us
•We are subject to stringent capital requirements, which could have an adverse effect on our operations
•We are subject to numerous laws designed to protect consumers, including the CRA and fair lending laws, and failure to comply with these laws could lead to a wide variety of sanctions
•We are a bank holding company and are dependent upon our Bank for cash flow, and our Bank’s ability to make cash distributions is restricted
•The Federal Reserve may require us to commit capital resources to support our Bank
Risks related to our common stock
•No public market exists for our common stock, and one may not develop
•Future sales of our common stock could depress the market price of our common stock
•As of December 31, 2024, approximately 32.9% of our voting and non-voting common stock is owned by certain institutional holders, and future sales by these institutional holders may adversely affect the prevailing market price of our common stock
•Our stock price may be volatile, and you could lose part or all of your investment as a result
•We may not pay dividends on our common stock in the future, and our ability to pay dividends is subject to certain restrictions
•The holders of our debt obligations and preferred stock will have priority over our common stock with respect to payment in the event of liquidation, dissolution or winding up and with respect to the payment of interest and dividends
•Michigan law and the provisions of our Amended and Restated Articles of Incorporation and Amended and Restated Bylaws may have an anti-takeover effect, and there are substantial regulatory limitations on changes of control of bank holding companies
•An investment in our common stock is not an insured deposit
Risks Related to Our Business
Decreased residential mortgage origination, competition, and changes in interest rates may adversely affect our profitability.
We currently operate a residential mortgage origination, MPP facility, and servicing business. Changes in interest rates and pricing decisions by our competitors may adversely affect demand for our mortgage loan products, the revenue realized on the sale of loans, revenues received from servicing such loans and the valuation of our mortgage servicing rights.
The banking and mortgage origination businesses are highly competitive, and we experience competition in our market from many other financial institutions. Our operations consist of offering banking and residential mortgage services as well as
18
warehouse alternative mortgage financing through our MPP business. Many of our competitors offer the same, or a wider variety of, banking and related financial services within our market areas. These competitors include national banks, regional banks, community banks, mortgage companies, and many other types of financial institutions, including savings and loan institutions, finance companies, credit unions, and other financial intermediaries. Additionally, we face growing competition from online businesses with few or no physical locations, including online banks, lenders and consumer lending platforms. Increased competition in our markets may result in reduced loans, deposits and fees, as well as reduced net interest margin and profitability. Ultimately, we may not be able to compete successfully against current and future competitors. If we are unable to attract and retain customers in our mortgage origination, MPP, and banking businesses, we may be unable to continue to grow our business, and our financial condition and results of operations may be adversely affected.
Many of our non-bank competitors are not subject to the same extensive regulations that govern our activities and may have greater flexibility in competing for business. The financial services industry could become even more competitive as a result of legislative, regulatory and technological changes and continued consolidation. In addition, some of our current MPP clients may seek alternative financing sources as they develop needs for warehouse alternative facilities larger than we may be able to accommodate. Our inability to compete successfully in the markets in which we operate could have an adverse effect on our business, financial condition or results of operations.
Mortgage production, especially refinancing activity, declines in high interest rate environments. Interest rates have been elevated in recent years. Although interest rates have begun to decline, there is no assurance that the trend will continue, and continued high interest rates may inhibit our ability to increase our mortgage production. Moreover, if interest rates increase further, there can be no assurance that our mortgage production will continue at current levels.
Our mortgage banking profitability could significantly decline if we are not able to originate and resell a high volume of mortgage loans.
Because we sell a substantial portion of the mortgage loans we originate, the profitability of our mortgage banking business also depends in large part on our ability to aggregate a high volume of loans and sell them at a gain in the secondary market. Thus, in addition to our dependence on the interest rate environment, we are dependent upon (i) the existence of an active secondary market and (ii) our ability to profitably sell loans or securities into that market. If our level of mortgage production declines, the profitability will depend upon our ability to reduce our costs commensurate with the reduction of revenue from our mortgage operations.
Our ability to sell mortgage loans readily is dependent upon our ability to remain eligible for the programs offered by GSEs, and other institutional and non-institutional investors. Any significant impairment of our eligibility with any of the GSEs could materially and adversely affect our operations. Further, the criteria for loans to be accepted under such programs may be changed from time to time by the sponsoring entity, which could result in a lower volume of corresponding loan originations. The profitability of participating in specific programs may vary depending on a number of factors, including our administrative costs of originating qualifying loans and our costs of meeting such criteria.
The ability for us and our clients to originate and sell residential mortgage loans is dependent upon the availability of an active secondary market for single-family mortgage loans, which in turn depends in part upon the continuation of programs currently offered by GSEs and other institutional and non-institutional investors. These entities account for a substantial portion of the secondary market in residential mortgage loans. Because the largest participants in the secondary market are Fannie Mae and Freddie Mac, GSEs whose activities are governed by federal law, any future changes in laws that significantly affect the activity of these GSEs could, in turn, adversely affect our operations. In September 2008, Fannie Mae and Freddie Mac were placed into conservatorship by the U.S. government. The federal government has for many years considered proposals to reform Fannie Mae and Freddie Mac, but the results of any such reform, and their impact on us, are difficult to predict. To date, no reform proposal has been enacted.
A decline in our MPP business could have a significant impact on our results of operations.
Our MPP business accounted for 23.3% of our total revenues for the year ended December 31, 2024. All our MPP clients are residential mortgage originators who are subject to many of the same risks that affect our mortgage origination business. Accordingly, macroeconomic factors that may result in a decrease in our mortgage origination revenue would have a similar effect on our MPP revenue.
An increase in competition in MPP, including from GSEs or new market entrants, could adversely affect our financial condition and results of operations. Additionally, if GSEs who purchase loans from our MPP clients develop real-time funding products for mortgage originators, our MPP clients’ need for funding facilities such as our MPP facilities would be reduced.
19
The mortgage originators that participate in the MPP may also have fewer resources to weather adverse business developments, which may impair their ability to continue as going concerns and originate new mortgage loans. If a mortgage originator that participates in the MPP defaults on its obligations to us, we have recourse against both the mortgage originator and any unsold loans on our facility originated by the mortgage originator, but it is still possible that we may not be made whole.
Because a significant portion of our loan portfolio is comprised of real estate loans, negative changes in the economy affecting real estate values and liquidity could impair the value of collateral securing our real estate loans and result in loan and other losses.
At December 31, 2024, approximately 99% of our loan portfolio was comprised of loans with real estate as a primary or secondary component of collateral. As a result, adverse developments affecting real estate values in our market areas could increase the credit risk associated with our real estate loan portfolio. The market value of real estate can fluctuate significantly in a short period of time as a result of market conditions in the area in which the real estate is located. Adverse changes affecting real estate values and the liquidity of real estate in one or more of our markets could increase the credit risk associated with our loan portfolio, significantly impairing the value of property pledged as collateral on loans and affect our ability to sell the collateral upon foreclosure without a loss, any losses would adversely affect profitability. Such declines and losses could have a material adverse impact on our business, results of operations and growth prospects. In addition, if hazardous or toxic substances are found on properties pledged as collateral, the value of the real estate could be impaired. If we foreclose on and and take title to such properties, we may be liable for remediation costs, as well as for personal injury and property damage. Environmental laws may also require us to incur substantial expenses to address unknown liabilities and may materially reduce the affected property’s value or limit our ability to use or sell the affected property.
A decline in general business and economic conditions and any regulatory responses to such conditions could have a material adverse effect on our business, financial position, results of operations and growth prospects.
Our business and operations are sensitive to general business and economic conditions in the United States. If the national, regional and local economies experience worsening economic conditions, including high levels of unemployment, our growth and profitability could be constrained. Additionally, our ability to assess the credit-worthiness of our customers is made more complex by uncertain business and economic conditions. Weak economic conditions are characterized by, among other indicators, deflation, elevated levels of unemployment, fluctuations in debt and equity capital markets, increased delinquencies on mortgage, commercial and consumer loans, residential and commercial real estate price declines, increases in non- performing assets and foreclosures, and lower home sales and commercial activity. All of these factors are generally detrimental to our business. Our business is significantly affected by monetary and other regulatory policies of the U.S. federal government, its agencies and GSEs. Changes in any of these policies are influenced by macroeconomic conditions and other factors that are beyond our control, are difficult to predict and could have a material adverse effect on our business, financial position, results of operations and growth prospects.
Liquidity risks could affect operations and jeopardize our business, financial condition, and results of operations, and deposits, many of which are brokered deposits, are our primary source of funding.
Liquidity is essential to our business. Our primary source of funding is deposits, and such deposits substantially consist of brokered deposits. An inability to raise funds through deposits, borrowings, the sale of loans and/or investment securities and from other sources could have a substantial negative effect on our liquidity. A source of our funds consists of our customer deposits. These deposits are subject to potentially dramatic fluctuations in availability or price due to certain factors that may be outside of our control, such as a loss of confidence by customers in us or the banking sector generally, customer perceptions of our financial health and general reputation, increasing competitive pressures from other financial services firms for consumer or corporate customer deposits, changes in interest rates and returns on other investment classes. If customers move money out of bank deposits and into other investments, we could lose a relatively low cost source of funds, which would require us to seek wholesale funding alternatives in order to continue to grow, thereby increasing our funding costs and reducing our net interest income and net income.
Additional liquidity is provided by brokered deposits and our ability to borrow from the FHLB. As of December 31, 2024, brokered deposits were approximately $1.82 billion, or 53.1% of our total deposits. Brokered deposits may be more rate sensitive than other sources of funding. In the future, those depositors may not replace their brokered deposits with us as they mature, or we may have to pay a higher rate of interest to keep those deposits or to replace them with other deposits or other sources of funds. Not being able to maintain or replace those deposits as they mature would adversely affect our liquidity. Additionally, if our Bank does not maintain its well-capitalized position, it may not accept or renew any brokered deposits without a waiver granted by the FDIC. We also may borrow from third-party lenders from time to time. Our access to funding
20
sources in amounts adequate to finance or capitalize our activities or on terms that are acceptable to us could be impaired by factors that affect us directly or the financial services industry or economy in general, such as disruptions in the financial markets or negative views and expectations about the prospects for the financial services industry.
Additionally, as a BHC, we are dependent on dividends from our subsidiaries as our primary source of income. Our subsidiaries are subject to certain legal and regulatory limitations on their ability to pay us dividends. Any reduction or limitation on our subsidiaries abilities to pay us dividends could have a material adverse effect on our liquidity and in particular, affect our ability to repay our borrowings.
Any decline in available funding, including a decrease in brokered deposits, could adversely impact our ability to continue to implement our strategic plan, including our ability to originate loans, fund MPP commitments, meet our expenses, declare and pay dividends to our stockholders or to fulfill obligations such as repaying our borrowings or meeting deposit withdrawal demands, any of which could have a material adverse impact on our liquidity, business, financial condition and results of operations.
We rely on participations from third parties as an important funding source.
We frequently sell participations in MPP facilities to third parties in order to manage concentration risk and provide an additional source of funding. If we are not able to maintain and attract such third parties to participate in these transactions or if any existing third parties terminate their participations in existing MPP facilities, then we could face loan concentration issues and capital constraints as we seek to provide alternative funding for the affected MPP facilities.
Fluctuations in interest rates may reduce net interest income and otherwise negatively impact our financial condition and results of operations.
Net interest income is the difference between the amounts received by us on our interest-earning assets and the interest paid by us on our interest-bearing liabilities. When interest rates rise, the rate of interest we pay on our liabilities, such as deposits, rises more quickly than the rate of interest that we receive on our interest-bearing assets, such as loans, which may cause our profits to decrease. The impact on earnings is more adverse when short-term interest rates increase more than long-term interest rates or when long-term interest rates decrease more than short-term interest rates, leading to similar yields between short-term and long-term rates. Many factors impact interest rates, including governmental monetary policies, trade/tariff policies, inflation, recession, changes in unemployment, the money supply and international economic weaknesses and disorder and instability in domestic and foreign financial markets.
Interest rate increases often result in larger payment requirements for our borrowers, which increases the potential for default. At the same time, the marketability of the underlying property may be adversely affected by any reduced demand resulting from higher interest rates. In a declining interest rate environment, there may be an increase in prepayments on loans as borrowers refinance their mortgages and other indebtedness at lower rates.
As interest rates decrease, the potential for prepayment on our mortgage servicing rights increases and the fair market value of our mortgage servicing rights assets may decrease. Our ability to mitigate this decrease in value is largely dependent on our ability to be the refinancer and retain servicing rights. While we have previously been successful in our servicing retention, we may not be able to achieve the same level of retention in the future.
Changes in interest rates also can affect the value of loans, securities and other assets. An increase in interest rates that adversely affects the ability of borrowers to pay the principal or interest on loans may lead to an increase in nonperforming assets and a reduction of income recognized, which could have a material adverse effect on our results of operations and cash flows. Further, when we place a loan on nonaccrual status, we reverse any accrued but unpaid interest receivable, which decreases interest income. Subsequently, we continue to have a cost to fund the loan, which is reflected as interest expense, without any interest income to offset the associated funding expense. Thus, an increase in the amount of nonperforming assets would have an adverse impact on net interest income.
Rising interest rates will result in a decline in value of any fixed rate mortgage loans that we hold on our balance sheet and any fixed-rate debt securities we may hold in an investment securities portfolio. The unrealized losses resulting from holding these securities would be recognized in other comprehensive income (loss) and reduce total stockholders’ equity. Unrealized losses do not negatively impact our regulatory capital ratios; however, tangible common equity and the associated ratios would be reduced. If debt securities in an unrealized loss position are sold, such losses become realized and will reduce our regulatory capital ratios.
21
If interest rates decline for a prolonged period we could experience net interest margin compression as our interest earning assets could reprice downward while our interest-bearing liability rates could fail to decline in tandem. This could have an adverse effect on our net interest income and our results of operations.
If we do not effectively manage our credit risk, we may experience increased levels of delinquencies, nonperforming loans and charge-offs, which could require increases in our allowance for credit losses.
There are risks inherent in making any loan, including risks inherent in dealing with individual borrowers, risks of nonpayment, risks resulting from uncertainties as to the future value of collateral and cash flows available to service debt and risks resulting from changes in economic and market conditions. We cannot guarantee that our credit underwriting, credit monitoring, and risk management procedures will adequately reduce these credit risks, and they cannot be expected to completely eliminate our credit risks. If the overall economic climate in the United States, generally, or our market areas, specifically, declines, our borrowers may experience difficulties in repaying their loans, and the level of nonperforming loans, charge- offs and delinquencies could rise and require further increases in the allowance for credit losses, which would cause our net income, return on equity and capital to decrease.
Nonperforming assets take significant time to resolve and adversely affect our financial condition and results of operations, and could result in further losses in the future.
Our nonperforming assets adversely affect our net income in various ways. We do not record interest income on nonaccrual loans or other real estate owned, thereby adversely affecting our net income and returns on assets and equity, increasing our loan administration costs and adversely affecting our efficiency ratio. When we take collateral in foreclosure and similar proceedings, we are required to mark the collateral to its then-fair market value, which may result in a loss. These nonperforming loans and other real estate owned also increase our risk profile and the level of capital our regulators believe is appropriate for us to maintain in light of such risks. The resolution of nonperforming assets requires significant time commitments from management and can be detrimental to the performance of their other responsibilities. If we experience increases in nonperforming loans and nonperforming assets, our net interest income may be negatively impacted and our loan administration costs could increase, each of which could have an adverse effect on our net income and related ratios, such as return on assets and equity.
As of December 31, 2024, our nonperforming loans (which consist of nonaccrual loans and loans past due 90 days or more and still accruing interest, including loans reported at fair value) totaled $79.0 million, or 1.70% of total loans, and our nonperforming assets (which include nonperforming loans and other real estate owned at December 31, 2024) totaled $82.0 million, or 1.57% of total assets. In addition, we had $44.6 million in accruing loans that were 31 – 89 days delinquent as of December 31, 2024.
We may be required to repurchase or substitute mortgage loans or mortgage servicing rights (“MSRs”) that we have sold, or indemnify purchasers of our mortgage loans or MSRs.
We make representations and warranties to purchasers when we sell them a mortgage loan or an MSR, including in connection with securitizations. If a mortgage loan or MSR does not comply with the representations and warranties that we made with respect to it at the time of its sale, we could be required to repurchase the loan and/or indemnify secondary market purchasers for losses. If this occurs, we may have to bear any associated losses directly, as repurchased loans typically can only be resold at a steep discount to their repurchase price, if at all. We also may be subject to claims by purchasers for repayment of a portion of the premium we received from such purchaser on the sale of certain loans or MSRs if such loans or MSRs are repaid in their entirety within a specified time period after the sale of the loan. As of December 31, 2024, we accrued $2.6 million in expenses in connection with our reserve for repurchase and indemnification obligations. Actual repurchase and indemnification obligations could materially exceed the reserves we have recorded in our financial statements. Any significant repurchases, substitutions, indemnifications or premium recapture could be detrimental to our business.
Additionally, we may not be able to recover amounts from some third parties from whom we may seek indemnification or against whom we may assert a loan repurchase demand in connection with a breach of a representation or warranty due to financial difficulties or otherwise. As a result, we are exposed to counterparty risk in the event of non-performance by counterparties to our various contracts, including, without limitation, as a result of the rejection of an agreement or transaction in bankruptcy proceedings, which could result in substantial losses for which we may not have insurance coverage.
We engage in lending secured by real estate and may be forced to foreclose on the collateral and own the underlying real estate, subjecting us to the costs and potential risks associated with the ownership of real property, or consumer protection
22
initiatives or changes in state or federal law may substantially raise the cost of foreclosure or prevent us from foreclosing at all.
Since we originate loans secured by real estate, we may have to foreclose on the collateral property to protect our investment and may thereafter own and operate such property, in which case we would be exposed to the risks inherent in the ownership of real estate. The amount that we, as a mortgagee, may realize after a foreclosure depends on factors outside of our control, including, but not limited to, general or local economic conditions assessments, interest rates, real estate tax rates, governmental and regulatory rules, and natural disasters. Our inability to manage the amount of costs or size of the risks associated with the ownership of real estate, or write-downs in the value of other real estate owned could have an adverse effect on our business, financial condition and results of operations.
Additionally, consumer protection initiatives or changes in state or federal law may substantially increase the time and expenses associated with the foreclosure process or prevent us from foreclosing at all. A number of states in recent years have either considered or adopted foreclosure reform laws that make it substantially more difficult and expensive for lenders to foreclose on properties in default. Additionally, federal and state regulators have prosecuted or pursued enforcement action against a number of mortgage servicing companies for alleged consumer law violations. If new federal or state laws or regulations are ultimately enacted that significantly raise the cost of foreclosure or raise outright barriers to foreclosure, they could have an adverse effect on our business, financial condition and results of operations.
If we lose our ability to be a rated servicer, our business would be adversely affected.
We are currently rated by Fitch as a primary servicer. If we were to lose our servicer rating, our reputation would be adversely affected. Additionally, losing our servicer rating would inhibit us from servicing securitized mortgage loans, which would result in a decrease in our mortgage servicing revenue.
The Current Expected Credit Loss accounting standard could add volatility to our allowance for credit losses and may have a material adverse effect on our financial condition and results of operations.
Effective January 1, 2023, we adopted the Financial Accounting Standards Board ("the FASB") Account Standards Update 2016-13, Financial Instruments - Credit Losses (Topic 326): Measurement of Credit Losses on Financial Instruments, commonly referred to as "CECL". CECL changed the allowance for credit losses methodology from an incurred loss impairment methodology to an expected loss methodology, which is more dependent on future economic forecasts, assumptions and models than previous accounting standards and could result in increases in, and add volatility to, our allowance for credit losses and future provisions for credit losses. These forecasts, assumptions and models are inherently uncertain and are based upon management's reasonable judgment in light of information currently available.
Our allowance for credit losses may prove to be insufficient to absorb actual losses in our loan portfolio.
We establish our allowance for credit losses and maintain it at a level that management considers adequate to absorb expected loan losses based on an analysis of our portfolio, the underlying health of our borrowers, future economic forecasts and general economic conditions. The allowance for credit losses represents our estimate of losses in the portfolio at each balance sheet date and is based upon relevant information available to us. The allowance contains provisions for losses that have been identified relating to specific borrowing relationships, as well as estimated losses in the loan portfolio and credit undertakings that are not specifically identified. Additions to the allowance for credit losses, which are charged to earnings through the provision for credit losses, are determined based on a variety of factors, including an analysis of the loan portfolio, historical loss experience, future economic forecasts and an evaluation of current economic conditions in our market areas. The determination of the appropriate level of the allowance for credit losses is inherently subjective and requires us to make significant estimates and assumptions regarding current credit risks and future trends, all of which may undergo material changes. The actual amount of loan losses is affected by changes in economic, operating and other conditions within our markets, which may be beyond our control, and such losses may exceed current estimates.
As of December 31, 2024, our allowance for credit losses as a percentage of total loans HFI was 0.25% and as a percentage of total nonaccrual loans was 26.4%. Although management believes that the allowance for credit losses is adequate to absorb losses on any existing loans that may become uncollectible, we may be required to take additional provisions for credit losses in the future to further supplement the allowance for credit losses, either due to management’s decision to do so or because our banking regulators require us to do so. Our bank regulatory agencies will periodically review our allowance for credit losses and the value attributed to nonaccrual loans or to real estate acquired through foreclosure and may require us to adjust our determination of the value for these items. These adjustments may adversely affect our business, financial condition and results of operations.
23
We depend on the accuracy and completeness of information provided by customers and counterparties.
In deciding whether to extend credit or enter into other transactions with customers and counterparties, we may rely on information furnished to us by or on behalf of customers and counterparties, including financial statements and other financial information. We also may rely on representations of customers and counterparties as to the accuracy and completeness of that information. In deciding whether to extend credit, we may rely upon our customers’ representations that their financial statements conform to GAAP and present fairly, in all material respects, the financial condition, results of operations and cash flows of the customer. We also may rely on customer representations and certifications, or other audit or accountants’ reports, with respect to the business and financial condition of our clients. Our financial condition, results of operations, financial reporting and reputation could be negatively affected if we rely on materially misleading, false, inaccurate or fraudulent information.
Our ability to maintain our reputation is critical to the success of our business, and the failure to do so may materially adversely affect our business and the value of our stock.
We are known nationally for mortgage origination, MPP facilities and loan servicing, and our reputation is one of the most valuable components of our business. As such, we strive to conduct our business in a manner that enhances our reputation. This is done, in part, by recruiting, hiring and retaining employees who share our core values of being an integral part of the communities we serve, delivering superior service to our customers and caring about our customers and employees. If our reputation is negatively affected, by the actions of our employees or otherwise, our business and, therefore, our operating results and the value of our stock may be materially adversely affected.
Technology disruptions or failures, including a failure in our operational or security systems or infrastructure, or those of third parties with whom we do business, could disrupt our business, cause legal or reputational harm and adversely impact our financial condition and results of operations.
We are dependent on the secure, efficient, and uninterrupted operation of our technology infrastructure, including computer systems, related software applications and data centers, as well as those of certain third parties and affiliates. Our websites and computer/telecommunication networks must accommodate a high volume of traffic and deliver frequently updated information, the accuracy and timeliness of which is critical to our business. Our technology must be able to facilitate a loan application experience that equals or exceeds the experience provided by our competitors. We have or may in the future experience service disruptions and failures caused by system or software failure, fire, power loss, telecommunications failures, team member misconduct, human error, computer threat actors, computer viruses and disabling devices, malicious or destructive code, denial of service or information, as well as natural disasters, health pandemics and other similar events and our disaster recovery planning may not be sufficient for all situations. The implementation of technology changes and upgrades to maintain current and integrate new technology systems may also cause service interruptions. Any such disruption could interrupt or delay our ability to provide services to our clients and loan applicants, and could also impair the ability of third parties to provide critical services to us.
Additionally, the technology and other controls and processes we have created to help us identify misrepresented information in our loan origination operations were designed to obtain reasonable, not absolute, assurance that such information is identified and addressed appropriately. Accordingly, such controls may not have detected, and may fail in the future to detect, all misrepresented information in our loan origination operations. If our operations are disrupted or otherwise negatively affected by a technology disruption or failure, this could result in client dissatisfaction and damage to our reputation and brand, and material adverse impacts on our business. We do not carry business interruption insurance sufficient to compensate us for all losses that may result from interruptions in our service as a result of systems disruptions, failures and similar events.
Cyberattacks and other data and security incidents could result in serious harm to our reputation and adversely affect our business.
We are dependent on information technology networks and systems, including those we maintain with our third-party vendors, including the internet, to securely collect, process, transmit and store electronic information. In the ordinary course of our business, we receive, process, retain and transmit proprietary information and sensitive or confidential data, including the public and non-public personal information of our team members, clients and loan applicants. Despite devoting significant time and resources to ensure the integrity of our information technology systems, we have not always been able to, and may not be able to in the future, anticipate or implement effective preventive measures against all security incidents or unauthorized access of our information technology systems or the information technology systems of third-party vendors that receive, process, retain and transmit electronic information on our behalf.
24
Security incidents, acts of vandalism, natural disasters, fire, power loss, telecommunication failures, team member misconduct, human error and developments in computer intrusion capabilities could result in a compromise or breach of the technology that we or our third-party vendors use to collect, process, retain, transmit and protect the personal information and transaction data of our team members, clients and loan applicants. Similar events outside of our control can also affect the demands we and our third-party vendors may make to respond to any security incidents or similar disruptive events. We invest in industry-standard security technology designed to protect our data and business processes against risk of a data security incidents and cyberattack. Our data security management program includes identity, trust, vulnerability and threat management business processes as well as the adoption of standard data protection policies. We measure our data security effectiveness through industry-accepted methods and remediate significant findings. The technology and other controls and processes designed to secure our team member, client and loan applicant information and to prevent, detect and remedy any unauthorized access to that information were designed to obtain reasonable, but not absolute, assurance that such information is secure and that any unauthorized access is identified and addressed appropriately. Such controls have not always detected, and may in the future fail to prevent or detect, unauthorized access to our team member, client and loan applicant information.
The techniques used to obtain unauthorized, improper or illegal access to our systems and those of our third-party vendors, our data, our team members’, clients’ and loan applicants’ data or to disable, degrade or sabotage service are constantly evolving, and have become increasingly complex and sophisticated. Furthermore, such techniques change frequently and are often not recognized or detected until after they have been launched, and therefore, we may be unable to anticipate these techniques and may not become aware in a timely manner of such a security incident, which could exacerbate any damage we experience. Cyber security attacks can originate from a wide variety of sources, including third parties such as criminal threat actors, persons involved with organized crime or associated with external service providers, or foreign state or foreign state-supported actors. Those parties may also attempt to fraudulently induce team members, vendors’ clients and loan applicants or other users of our systems to disclose sensitive information in order to gain access to our data or that of our team members, clients and loan applicants.
Cybersecurity risks for lenders have significantly increased in recent years, in part, because of the proliferation of new technologies, the use of the internet and telecommunications technologies to conduct financial transactions, and the increased sophistication and activities of criminal threat actors, organized crime, terrorists, and other external parties, including foreign state actors. We, our clients and loan applicants, regulators and other third parties have been subject to, and are likely to continue to be the target of, cyberattacks. These cyberattacks could include computer viruses, malicious or destructive code, phishing attacks, brute force attacks, denial of service, improper access by team members or third-party vendors, exploiting software vulnerabilities (including “zero-day attacks”), ransomware or other malware, supply chain attacks,or other security incidents that have or could in the future result in the unauthorized release, gathering, monitoring, misuse, loss or destruction of confidential, proprietary and other information of ours, our team members, our clients and loan applicants or of third parties, or otherwise materially disrupt our or our clients’ and loan applicants’ or other third parties’ network access or business operations.
Additionally, cyberattacks on local and state government databases and offices, including the rising trend of ransomware attacks, expose us to the risk of losing access to critical data and the ability to provide services to our clients. These attacks can cause havoc and have at times led title insurance underwriters to prohibit us from issuing policies, and to suspend closings, on properties located in the affected counties or states.
Any penetration of our or our third-party vendors’ information technology systems, network security, mobile devices or other misappropriation or misuse of personal information of our team members, clients or loan applicants, including wire fraud, phishing attacks and business e-mail compromise, could cause interruptions in the operations of our businesses, financial loss to our clients or loan applicants, damage to our computers or operating systems and to those of our clients, loan applicants and counterparties, and subject us to increased costs, loss of revenue, loss of business and customers, litigation, disputes, damages, increased cybersecurity costs, and other liabilities. In addition, the foregoing events could result in violations of applicable privacy and other laws. If this information is inappropriately accessed and used by a third party or a team member for improper or unauthorized purposes, such as identity theft, we may be responsible to the affected individuals for any losses they may have incurred as a result of misappropriation. In such an instance, we may also be subject to regulatory action, increased regulatory scrutiny, investigation, or liability to a governmental authority for fines or penalties (which may not be covered by our insurance), associated with a lapse in the integrity and security of our team members’, clients’ and loan applicants’ information. We may be required to expend significant capital and other resources to protect against and remedy any potential or existing security incidents and their consequences. In addition, our remediation efforts may not be successful and we may not have adequate insurance to cover these losses
Security incidents could also significantly damage our reputation with existing and prospective clients and third parties with whom we do business. Any publicized security problems affecting our businesses and/or those of such third parties may
25
negatively impact the market perception of our products and discourage clients from doing business with us. These risks may increase in the future as we continue to increase our reliance on the internet and use of web-based product offerings.
We may not be able to make technological improvements as quickly as demanded by our customers, which could harm our ability to attract customers and adversely affect our financial condition, results of operations, and liquidity.
The financial services industry is undergoing rapid technological changes, with frequent introductions of new technology-driven products and services (including those related to or involving artificial intelligence, machine learning, blockchain and other distributed ledger technologies). The effective use of technology increases efficiency and enables financial and lending institutions to better serve clients and reduce costs. Our future success will depend, in part, upon our ability to address the needs of our clients by using technology, such as mobile and online services, to provide products and services that will satisfy client demands for convenience, as well as to create additional efficiencies in our operations. We may not be able to effectively implement new technology- driven products and services as quickly as competitors or be successful in marketing these products and services to our clients. Failure to successfully keep pace with technological change affecting the financial services industry could harm our ability to attract customers and adversely affect our financial condition, results of operations, and liquidity.
Our products use software, hardware and services that may be difficult to replace or cause errors or failures of our products that could adversely affect our business.
In addition to our custom-curated and proprietary software, we license third-party software, utilize third-party hardware and depend on services from various third parties for use in our products. In the future, this software or these services may not be available to us on commercially reasonable terms, or at all. Any loss of the right to use any of the software or services could result in decreased functionality of our products until equivalent technology is either developed by us or, if available from another provider, is identified, obtained and integrated, which could adversely affect our business. In addition, any errors or defects in or failures of the software or services we rely on, whether maintained by us or by third parties, could result in errors or defects in our products or cause our products to fail, which could adversely affect our business and be costly to correct. Many of our third-party providers attempt to impose limitations on their liability for such errors, defects or failures, and if enforceable, we may have additional liability to our clients or to other third parties that could harm our reputation and increase our operating costs. We will need to maintain our relationships with third-party software and service providers and to obtain software and services from such providers that do not contain any errors or defects. Any failure to do so could adversely affect our ability to deliver effective products to our clients and loan applicants and adversely affect our business.
The developments and use of artificial intelligent (AI) presents risks and challenges that may adversely impact our business.
The Company or its third-party (or fourth party) vendors, clients or counterparties may develop or incorporate AI technology in certain business processes, services, or products. The development and use of AI presents a number of risks and challenges to the Company’s business. The legal and regulatory environment relating to AI is uncertain and rapidly evolving, both in the U.S. and internationally, and includes regulatory schemes targeted specifically at AI as well as provisions in intellectual property, privacy, consumer protection, employment, and other laws applicable to the use of AI. These evolving laws and regulations could require changes in the Company’s implementation of AI technology and increase the Company’s compliance costs and the risk of non-compliance. AI models, particularly generative AI models, may produce output or take action that is incorrect, that reflects biases included in the data on which they are trained, that results in the release of private, confidential, or proprietary information, that infringes on the intellectual property rights of others, or that is otherwise harmful. In addition, the complexity of many AI models makes it difficult to understand why they are generating particular outputs. This limited transparency increases the challenges associated with assessing the proper operation of AI models, understanding and monitoring the capabilities of the AI models, reducing erroneous output, eliminating bias, and complying with regulations that require documentation or explanation of the basis on which decisions are made. Further, the Company may rely on AI models developed by third parties, and, to that extent, would be dependent in part on the manner in which those third parties develop and train their models, including risks arising from the inclusion of any unauthorized material in the training data for their models and the effectiveness of the steps these third parties have taken to limit the risks associated with the output of their models, matters over which the Company may have limited visibility. Any of these risks could expose the Company to liability or adverse legal or regulatory consequences and harm the Company’s reputation and the public perception of its business or the effectiveness of its security measures.
26
We are, and intend to continue, developing new products and services, and our failure to accurately predict their demand or growth could have an adverse effect on our business.
We are, and intend in the future to continue, investing significant resources in developing new tools, features, services, products and other offerings. New initiatives are inherently risky, as each involves unproven business strategies and new products and services with which we have limited or no prior development or operating experience. Risks from our innovative initiatives include those associated with potential defects in the design and development of the technologies used to automate processes, misapplication of technologies, the reliance on data that may prove inadequate, and failure to meet client expectations, among others. Any new line of business, product, product enhancement or service could have a significant impact on the effectiveness of our system of internal controls. As a result of these risks, we could experience increased claims, reputational damage or other adverse effects, which could be material. Additionally, we can provide no assurance that we will be able to develop, commercially market and achieve acceptance of our new products and services. External factors, such as compliance with regulations, competitive alternatives and shifting market preferences, may also impact the ultimate implementation of a new line of business or offerings of new products, product enhancements or services. In addition, our investment of resources to develop new products and services may either be insufficient or result in expenses that are excessive in light of revenue actually originated from these new products and services.
The profile of potential clients using our new products and services may not be as attractive as the profile of the clients that we currently serve, which may lead to higher levels of delinquencies or defaults than we have historically experienced. Failure to accurately predict demand or growth with respect to our new products and services could have an adverse impact on our business, and there is always risk that these new products and services will be unprofitable, will increase our costs or will decrease our operating margins or take longer than anticipated to achieve target margins. Further, our development efforts with respect to these initiatives could distract management from current operations and could divert capital and other resources from our existing business. Failure to successfully manage these risks in the development and implementation of new lines of business or offerings of new products, product enhancements or services could have an adverse effect on our business, financial condition and results of operations.
We depend on our ability to sell loans in the secondary market to a limited number of investors and to the GSEs, and to securitize our loans into MBS through the GSEs. If our ability to sell or securitize mortgage loans is impaired, whether as a result of regulatory action or otherwise, the volume of mortgage loans that we are able to originate will be reduced.
A substantial portion of our loan originations are sold into the secondary market. We sell whole loans and loans securitized into MBS through Fannie Mae, Freddie Mac and Ginnie Mae. Loans originated outside of Fannie Mae, Freddie Mac, and the guidelines of the Federal Housing Administration, U.S Department of Agriculture, or VA (for loans securitized with Ginnie Mae) are sold to private investors and mortgage conduits.
The gain recognized from sales in the secondary market represents a significant portion of our revenues and net earnings. A decrease in the prices paid to us upon sale of our loans could be detrimental to our business, as we are dependent on the cash generated from such sales to fund our future loan closings and repay borrowings under our loan funding facilities. If it is not possible or economical for us to complete the sale or securitization of certain of our loans held for sale, we may lack liquidity to continue to fund such loans and our revenues and margins on new loan originations could be materially and negatively impacted. The severity of the impact would be most significant to the extent we were unable to sell conforming home loans to the GSEs or securitize such loans pursuant to the GSEs and government agency-sponsored programs.
Further, there may be delays in our ability to sell future mortgage loans which we originate, or there may be a market shift that causes buyers of our non-GSE products to reduce their demand for such products. These market shifts can be caused by factors outside of our control that affect investor appetite for such non- GSE products. To the extent that happens, we could need to reduce our origination volume. Delays in the sale of mortgage loans also increases our exposure to market risks, which could adversely affect our profitability on sales of loans. Any such delays or failure to sell loans could be detrimental to our business.
Our hedging strategies may not be successful in mitigating our risks associated with changes in interest rates.
Our profitability is directly affected by changes in interest rates. The market value of closed loans held for sale and interest rate locks generally change along with interest rates. The value of such assets moves opposite of interest rate changes. For example, as interest rates rise, the value of existing mortgage assets falls.
27
We employ various economic hedging strategies to mitigate the interest rate and the anticipated loan financing probability or “pull-through risk” inherent in such mortgage assets. Our use of these hedge instruments may expose us to counterparty risk as they are not traded on regulated exchanges or guaranteed by an exchange or its clearinghouse and, consequently, there may not be the same level of protections with respect to margin requirements and positions and other requirements designed to protect both us and our counterparties. Furthermore, the enforceability of agreements underlying hedging transactions may depend on compliance with applicable statutory, commodity and other regulatory requirements and, depending on the domicile of the counterparty, applicable international requirements. Consequently, if a counterparty fails to perform under a derivative agreement, we could incur a significant loss.
Our hedge instruments are accounted for as free-standing derivatives and are included on our consolidated balance sheet at fair market value. Our operating results could be negatively affected because the losses on the hedge instruments we enter into may not be offset by a change in the fair value of the related hedged transaction.
Our hedging strategies also require us to provide cash margin to our hedging counterparties from time to time. Financial Industry Regulatory Authority, Inc. (“FINRA”) requires us to provide daily cash margin to (or receive daily cash margin from, depending on the daily value of related MBS) our hedging counterparties from time to time. The collection of daily margins between us and our hedging counterparties could, under certain MBS market conditions, adversely affect our short-term liquidity and cash-on-hand. Additionally, our hedge instruments may expose us to counterparty risk — the possibility that a loss may occur from the failure of another party to perform in accordance with the terms of the contract, which loss exceeds the value of existing collateral, if any.
Our hedging activities in the future may include entering into interest rate swaps, caps and floors, options to purchase these items, purchasing or selling U.S. Treasury securities, and/or other tools and strategies. These hedging decisions will be determined in light of the facts and circumstances existing at the time and may differ from our current hedging strategy. These hedging strategies may be less effective than our current hedging strategies in mitigating the risks described above, which could adversely affect our business and financial condition.
The accuracy of our financial statements and related disclosures could be affected if the judgments, assumptions or estimates used in our critical accounting policies are inaccurate.
The preparation of financial statements and related disclosures in conformity with GAAP requires us to make judgments, assumptions and estimates that affect the amounts reported in our consolidated financial statements and accompanying notes. Our critical accounting policies, which are included in the section entitled “Management’s Discussion and Analysis of Financial Condition and Results of Operations”, describe those significant accounting policies and methods used in the preparation of our consolidated financial statements that we consider “critical” because they require judgments, assumptions and estimates that materially affect our consolidated financial statements and related disclosures. As a result, if future events or regulatory views concerning such analysis differ significantly from the judgments, assumptions and estimates in our critical accounting policies, those events or assumptions could have a material impact on our consolidated financial statements and related disclosures, in each case resulting in our needing to revise or restate prior period financial statements, cause damage to our reputation and the price of our common stock, and adversely affect our business, financial condition and results of operations.
A portion of our assets are measured at fair value. Fair value determinations require many assumptions and complex analyses, and we cannot control many of the underlying factors. If our estimates prove to be incorrect, we may be required to write down the value of such assets, which could adversely affect our earnings, financial condition and liquidity.
We measure the fair value of our mortgage loans held for sale, derivatives, interest rate lock commitments (“IRLCs”) and MSRs on a recurring basis and we measure the fair value of other assets, such as certain mortgage loans HFI, certain impaired loans and other real estate owned, on a nonrecurring basis. Fair value determinations require many assumptions and complex analyses, especially to the extent there are not active markets for identical assets. For example, we generally estimate the fair value of loans held for sale based on quoted market prices for securities backed by similar types of loans. If quoted market prices are not available, fair value is estimated based on other relevant factors, including dealer price quotations and prices available for similar instruments, to approximate the amounts that would be received from a third party. In addition, the fair value of IRLCs are measured based upon the difference between the current fair value of similar loans (as determined generally for mortgages held for sale) and the price at which we have committed to originate the loans, subject to the anticipated loan financing probability, or pull-through factor (which is both significant and highly subjective).
Further, MSRs do not trade in an active market with readily observable prices and therefore, their fair value is determined using a valuation model that calculates the present value of estimated net future cash flows, using estimates of prepayment speeds, discount rate, cost to service, float earnings, contractual servicing fee income and ancillary income, and late fees.
28
If our estimates of fair value prove to be incorrect, we may be required to write down the value of such assets, which could adversely affect our financial condition and results of operations.
Because accounting rules for valuing certain assets and liabilities are highly complex and involve significant judgment and assumptions, these complexities could lead to a delay in preparation of financial information and the delivery of this information to our stockholders and also increase the risk of errors and restatements, as well as the cost of compliance.
We are dependent on the use of data and modeling in our management’s decision-making, and faulty data or modeling approaches could negatively impact our decision-making ability or possibly subject us to regulatory scrutiny in the future.
The use of statistical and quantitative models and other quantitative analyses is critical to bank decision- making, and the employment of such analyses is becoming increasingly widespread in our operations. Liquidity stress testing, interest rate sensitivity analysis, and the identification of possible violations of anti- money laundering regulations are all examples of areas in which we are dependent on models and the data that underlies them. The use of statistical and quantitative models is also becoming more prevalent in regulatory compliance. While we are not currently subject to annual Dodd-Frank Wall Street Reform and Consumer Protection Act of 2010 (the “Dodd-Frank Act”) stress testing (DFAST) and the Comprehensive Capital Analysis and Review (CCAR) submissions, we anticipate that model-derived testing may become more extensively implemented by regulators in the future. We anticipate data-based modeling will penetrate further into bank decision-making, particularly risk management efforts, as the capacities developed to meet rigorous stress testing requirements are able to be employed more widely and in differing applications. While we believe these quantitative techniques and approaches improve our decision-making, they also create the possibility that faulty data or flawed quantitative approaches could negatively impact our decision- making ability or, if we become subject to regulatory stress-testing in the future, it could result in adverse regulatory scrutiny. Secondarily, because of the complexity inherent in these approaches, misunderstanding or misuse of their outputs could similarly result in suboptimal decision-making.
Our success is largely dependent upon our ability to successfully execute our business strategy.
There can be no assurance that we will be able to continue to grow and to remain profitable in future periods, or, if profitable, that our overall earnings will remain consistent with our prior results of operations, or increase in the future. A downturn in economic conditions in our market, particularly in the real estate market, heightened competition from other financial services providers, an inability to retain or grow our core deposit base, regulatory and legislative considerations, and failure to attract and retain high-performing talent, among other factors, could limit our ability to grow assets, or increase profitability, as rapidly as we have in the past. Sustainable growth requires that we manage our risks by following prudent loan underwriting standards, balancing loan and deposit growth without materially increasing interest rate risk or compressing our net interest margin, maintaining more than adequate capital at all times, managing a growing number of customer relationships, scaling technology platforms, hiring and retaining qualified employees and successfully implementing our strategic initiatives. We must also successfully implement improvements to, or integrate, our management information and control systems, procedures and processes in an efficient and timely manner and identify deficiencies in existing systems and controls. In particular, our controls and procedures must be able to accommodate an increase in loan volume in various markets and the infrastructure that comes with expanding operations, including new branches. Our growth strategy may require us to incur additional expenditures to expand our administrative and operational infrastructure. If we are unable to effectively manage and grow our banking platform, we may experience compliance and operational problems, have to slow the pace of growth, or have to incur additional expenditures beyond current projections to support such growth. We may not have, or may not be able to develop, the knowledge or relationships necessary to be successful in new markets. Our failure to sustain our historical rate of growth, adequately manage the factors that have contributed to our growth or successfully enter new markets could have an adverse effect on our earnings and profitability and, therefore on our business, financial condition and results of operations.
We are highly dependent on our management team, and the loss of our senior executive officers or other key employees could harm our ability to implement our strategic plan, impair our relationships with customers and adversely affect our business, results of operations and growth prospects.
Our success is dependent, to a large degree, upon the continued service and skills of our executive management team.
Our business and growth strategies are built primarily upon our ability to retain employees with experience and business relationships within their respective market areas. We seek to manage the continuity of our executive management team through regular succession planning. As part of such succession planning, other executives and high performing individuals have been identified and are provided certain training in order to be prepared to assume particular management roles and responsibilities in the event of the departure of a member of our executive management team. However, the loss of any of our other key personnel could have an adverse impact on our business and growth because of their skills, years of industry experience, and knowledge of our market areas, our failure to develop and implement a viable succession plan, the difficulty of
29
finding qualified replacement personnel, or any difficulties associated with transitioning of responsibilities to any new members of the executive management team. While our mortgage originators and loan officers are generally subject to non-solicitation provisions as part of their employment, our ability to enforce such agreements may not fully mitigate the injury to our business from the breach of such agreements, as such employees could leave us and immediately begin soliciting our customers. The departure of any of our personnel who are not subject to enforceable non-competition agreements could have a material adverse impact on our business, results of operations and growth prospects.
Our operations could be interrupted if our third-party service providers experience difficulty, terminate their services or fail to comply with banking regulations.
We depend to a significant extent on a number of relationships with third-party service providers. Specifically, we receive core systems processing, essential web hosting and other internet systems, deposit processing and other processing services from third-party service providers. If these third-party service providers experience difficulties or terminate their services and we are unable to replace them with other service providers, our operations could be interrupted. If an interruption were to continue for a significant period of time, our business, financial condition and results of operations could be adversely affected, perhaps materially. Even if we are able to replace them, it may be at a higher cost to us, which could adversely affect our business, financial condition and results of operations.
We are subject to certain operational risks, including, but not limited to, customer or employee fraud and data processing system failures and errors.
Employee errors and employee and/or customer misconduct could subject us to financial losses or regulatory sanctions and seriously harm our reputation or financial performance. Misconduct by our employees could include, but is not limited to, hiding unauthorized activities from us, improper or unauthorized activities on behalf of our customers or improper use of confidential information. It is not always possible to prevent employee errors and misconduct, and the precautions we take to prevent and detect this activity may not be effective in all cases. Employee errors could also subject us to financial claims for negligence.
We maintain a system of internal controls and insurance coverage to mitigate against operational risks, including data processing system failures and errors and customer or employee fraud. If our internal controls fail to prevent or detect an occurrence, or if any resulting loss is not insured or exceeds applicable insurance limits, it could have a material adverse effect on our business, financial condition and results of operations.
We may not be able to overcome the integration and other risks associated with any future acquisitions, which could have an adverse effect on our ability to implement our business strategy.
Although we plan to continue to grow our business organically, we may pursue acquisition opportunities that we believe complement our activities and have the ability to enhance our profitability and provide attractive risk-adjusted returns. Our future acquisition activities could be material to our business and involve a number of risks, including the following:
•intense competition from other banking organizations and other acquirers for potential merger candidates;
•market pricing for desirable acquisitions resulting in returns that are less attractive than we have traditionally sought to achieve;
•incurring time and expense associated with identifying and evaluating potential acquisitions and negotiating potential transactions, resulting in our attention being diverted from the operation of our existing business;
•using inaccurate estimates and judgments to evaluate credit, operations, management and market risks with respect to the target institution or assets;
•potential exposure to unknown or contingent liabilities of banks and businesses we acquire, including consumer compliance issues;
•the time and expense required to integrate the operations and personnel of the combined businesses;
•experiencing higher operating expenses relative to operating income from the new operations;
•losing key employees and customers;
•reputational issues if the target’s management does not align with our culture and values;
30
•significant problems relating to the conversion of the financial and customer data of the target;
•integration of acquired customers into our financial and customer product systems;
•risks of impairment to goodwill; or
•regulatory timeframes for review of applications may limit the number and frequency of transactions we may be able to consummate.
Depending on the condition of any institution or assets or liabilities that we may acquire, that acquisition may, at least in the near term, adversely affect our capital and earnings and, if not successfully integrated with our organization, may continue to have such effects over a longer period. We may not be successful in overcoming these risks or any other problems encountered in connection with pending or potential acquisitions, and any acquisition we may consider will be subject to prior regulatory approval. Our inability to overcome these risks could have an adverse effect on our ability to implement our business strategy, which, in turn, could have an adverse effect on our business, financial condition and results of operations.
We may need to raise additional capital in the future, and if we fail to maintain sufficient capital, whether due to losses, an inability to raise additional capital or otherwise, our liquidity, financial condition, and results of operations, as well as our ability to maintain regulatory compliance, would be adversely affected.
We face significant capital and other regulatory requirements as a financial institution. We may need to raise additional capital in the future to provide us with sufficient capital resources and liquidity to meet our commitments and business needs, which could include the possibility of financing acquisitions. In addition, we, on a consolidated basis, and our Bank, on a stand-alone basis, must meet certain regulatory capital requirements and maintain sufficient liquidity. Importantly, regulatory capital requirements could increase from current levels, which could require us to raise additional capital or contract our operations. Our ability to raise additional capital depends on conditions in the capital markets, economic conditions and a number of other factors, including investor perceptions regarding the banking industry, market conditions and governmental activities, and on our financial condition and performance. Accordingly, we cannot assure you that we will be able to raise additional capital if needed or on terms acceptable to us. If we fail to maintain capital to meet regulatory requirements, our liquidity, financial condition, and results of operations would be materially and adversely affected.
Changes in accounting standards could materially impact our financial statements.
From time to time, the Financial Accounting Standards Board or the SEC may change the financial accounting and reporting standards that govern the preparation of our financial statements. Such changes may result in us being subject to new or changing accounting and reporting standards. In addition, the bodies that interpret the accounting standards (such as banking regulators or outside auditors) may change their interpretations or positions on how these standards should be applied. These changes may be beyond our control, can be hard to predict and can materially impact how we record and report our financial condition and results of operations. In some cases, we could be required to apply a new or revised standard retrospectively, or apply an existing standard differently, also retrospectively, in each case resulting in our needing to revise or restate prior period financial statements. Additionally, as an emerging growth company we intend to take advantage of extended transition periods for complying with new or revised accounting standards affecting public companies.
Litigation and regulatory actions, including possible enforcement actions, could subject us to significant fines, penalties, judgments or other requirements resulting in increased expenses or restrictions on our business activities.
In the normal course of business, from time to time, we have in the past and may in the future be named as a defendant in various legal actions, arising in connection with our current and/or prior business activities. Legal actions could include claims for substantial compensatory or punitive damages or claims for indeterminate amounts of damages. Further, in the future our regulators may impose consent orders, civil money penalties, matters requiring attention, or similar types of supervisory criticism. We may also, from time to time, be the subject of subpoenas, requests for information, reviews, investigations and proceedings (both formal and informal) by governmental agencies regarding our current and/or prior business activities. Any such legal or regulatory actions may subject us to substantial compensatory or punitive damages, significant fines, penalties, obligations to change our business practices or other requirements resulting in increased expenses, diminished income and damage to our reputation. Our involvement in any such matters, whether tangential or otherwise and even if the matters are ultimately determined in our favor, could also cause significant harm to our reputation and divert management attention from the operation of our business. Further, any settlement, consent order or adverse judgment in connection with any formal or informal proceeding or investigation by government agencies may result in litigation, investigations or proceedings as other litigants and government agencies begin independent reviews of the same activities. As a result, the outcome of legal and regulatory actions could have an adverse effect on our business, results of operations and results of operations.
31
Severe weather, natural disasters, pandemics, acts of war or terrorism or other external events could significantly impact our business.
Severe weather, natural disasters, widespread disease or pandemics, civil unrest, acts of war or terrorism or other adverse external events could have a significant impact on our ability to conduct business. In addition, such events could affect the stability of our deposit base, impair the value of collateral securing loans, cause significant property damage, result in loss of revenue or cause us to incur additional expenses. The occurrence of any of these events in the future could have a material adverse effect on our business, financial condition or results of operations.
If we fail to design, implement and maintain effective internal control over financial reporting or remediate any future material weakness in our internal control over financial reporting, we may be unable to accurately report our financial results or prevent fraud.
Our internal control over financial reporting is designed to provide reasonable assurance regarding the reliability of the financial reporting and the preparation of financial statements for external purposes in accordance with GAAP. Effective internal control over financial reporting is necessary for us to provide reliable reports and prevent fraud. We may not be able to identify all significant deficiencies and/or material weaknesses in our internal control over financial reporting in the future, and our failure to maintain effective internal control over financial reporting in accordance with Section 404 of the Sarbanes-Oxley Act could have an adverse effect on our business, financial condition and results of operations.
In the normal course of our operations, we may identify deficiencies that would have to be remediated to satisfy the SEC rules for certification of our internal control over financial reporting. A material weakness is defined by the standards issued by the PCAOB, as a deficiency, or combination of deficiencies, in internal control over financial reporting that results in a reasonable possibility that a material misstatement of our annual or interim financial statements will not be prevented or detected on a timely basis. As a consequence, we would have to disclose in periodic reports we file with the SEC any material weakness in our internal control over financial reporting. The existence of a material weakness would preclude management from concluding that our internal control over financial reporting is effective and, when we cease to be an emerging growth company under the JOBS Act, preclude our independent registered public accounting firm from rendering their report addressing an assessment of the effectiveness of our internal control over financial reporting. In addition, disclosures of deficiencies of this type in our SEC reports could cause investors to lose confidence in our financial reporting, and may negatively affect the market price of our common stock, and could result in the delisting of our securities from the securities exchanges on which they trade. Moreover, effective internal controls are necessary to produce reliable financial reports and to prevent fraud. If we have deficiencies in our disclosure controls and procedures or internal control over financial reporting, such deficiencies may adversely affect us.
If we are unable to successfully remediate future material weaknesses in our internal control over financial reporting, the accuracy and timing of our financial reporting may be adversely affected.
In preparing and reviewing our consolidated financial statements as of and for the nine months ended September 30, 2024, and 2023, and in connection with our restatement of previously issued consolidated financial statements for the years ended December 31, 2023 and 2022, we and our independent registered public accounting firm identified a material weakness in our internal control over financial reporting. The material weakness identified reflected an incorrect classification of revenue from the capitalization of MSRs within noninterest income. As a result, there were adjustments required in connection with preparing our consolidated financial statements for the nine months ended September 30, 2024, and 2023, and a restatement was required for our consolidated financial statements for the years ended 2023 and 2022. In response to this identified material weakness, we reclassified such related revenue under net gain on the sale of loans held for sale, previously classified under loan servicing fees. We updated our general ledger account line assignment to reflect gains from establishment of mortgage servicing rights as part of gain on sale of loans rather than loan servicing income. Our December 31, 2024 consolidated statements of income reflect this proper classification and we have concluded the material weakness is resolved at December 31, 2024.
However, we cannot assure you that we have identified all of our existing material weaknesses, or that we will not, in the future, have additional material weaknesses. Our independent registered public accounting firm has not performed an evaluation of our internal control over financial reporting during any period in accordance with the provisions of the Sarbanes-Oxley Act. We believe that it is possible that, had our independent registered public accounting firm performed an evaluation of our internal control over financial reporting in accordance with the provisions of the Sarbanes-Oxley Act, additional material weaknesses or significant control deficiencies may have been identified.
Additionally, we cannot assure you that we will be able to remediate any existing or future material weakness in a timely manner or at all. If our efforts to remediate an identified material weakness are not successful, or if other material weaknesses or other significant control deficiencies occur, our ability to accurately and timely report our financial results could be impaired,
32
which could result in late filings of our annual and quarterly reports under the Exchange Act as a public company, additional restatements of our consolidated financial statements, a decline in our stock price, suspension or delisting of our common stock from the NYSE, and have an adverse effect on our business, financial condition and results of operations.
Our business is susceptible to fraud.
The Company’s business exposes it to fraud risk from loan and deposit customers, the parties they do business with, as well as from employees, contractors and vendors. The Company relies on financial and other data from new and existing customers which could turn out to be fraudulent when accepting such customers, executing their financial transactions and making and purchasing loans and other financial assets. In times of increased economic stress, the Company is at increased risk of fraud losses. The Company believes it has underwriting and operational controls in place to prevent or detect such fraud, but cannot provide assurance that these controls will be effective in detecting fraud or that the Company will not experience fraud losses or incur costs or other damage related to such fraud, at levels that adversely affect financial results or reputation. The Company’s lending customers may also experience fraud in their businesses which could adversely affect their ability to repay their loans or make use of services. The Company’s and its customers’ exposure to fraud may increase the Company’s financial risk and reputation risk as it may result in unexpected litigation expense, other costs and loan losses that exceed those that have been provided for in the allowance for credit losses.
Risks Related to Our Industry and Regulation
Our industry is highly regulated, and the regulatory framework, together with any future legislative or regulatory changes, may have a materially adverse effect on our operations.
The banking industry is highly regulated and supervised under both federal and state laws and regulations that are intended primarily for the protection of depositors, customers, the public, the banking system as a whole or the FDIC Deposit Insurance Fund not for the protection of our stockholders and creditors. We are subject to regulation and supervision by the Federal Reserve, and our Bank is subject to regulation and supervision by the FDIC and the DIFS. Compliance with these laws and regulations can be difficult and costly, and changes to laws and regulations can impose additional compliance costs. The Dodd-Frank Act, which imposed significant regulatory and compliance changes on financial institutions, is an example of this type of federal law. The laws and regulations applicable to us govern a variety of matters, including permissible types, amounts and terms of loans and investments we may make, the maximum interest rate that may be charged, the amount of reserves we must hold against deposits we take, the types of deposits we may accept and the rates we may pay on such deposits, maintenance of adequate capital and liquidity, changes in control of us and our Bank, transactions between us and our Bank, handling of nonpublic information, restrictions on dividends and establishment of new offices. We must obtain approval from our regulators before engaging in certain activities, and there is risk that such approvals may not be granted, either in a timely manner or at all. These requirements may constrain our operations, and the adoption of new laws and changes to or repeal of existing laws may have an adverse effect on our business, financial condition and results of operations. Also, the burden imposed by those federal and state regulations may place banks in general, including our Bank in particular, at a competitive disadvantage compared to their non-bank competitors. Compliance with current and potential regulation, as well as supervisory scrutiny by our regulators, may significantly increase our costs, impede the efficiency of our internal business processes, require us to increase our regulatory capital, and limit our ability to pursue business opportunities in an efficient manner by requiring us to expend significant time, effort and resources to ensure compliance and respond to any regulatory inquiries or investigations. Our failure to comply with any applicable laws or regulations, or regulatory policies and interpretations of such laws and regulations, could result in sanctions by regulatory agencies, civil money penalties or damage to our reputation, all of which could have an adverse effect on our business, financial condition and results of operations.
Applicable laws, regulations, interpretations, enforcement policies and accounting principles have been subject to significant changes in recent years, and may be subject to significant future changes. Additionally, federal and state regulatory agencies may change the manner in which existing regulations are applied. We cannot predict the substance or effect of pending or future legislation or regulation or changes to the application of laws and regulations to us. Future changes may have an adverse effect on our business, financial condition and results of operations.
In addition, given the current economic and financial environment, regulators may elect to alter standards or the interpretation of the standards used to measure regulatory compliance or to determine the adequacy of liquidity, risk management or other operational practices for financial service companies in a manner that impacts our ability to implement our strategy and could affect us in substantial and unpredictable ways, and could have an adverse effect on our business, financial condition and results of operations. Furthermore, the regulatory agencies have broad discretion in their interpretation of laws and regulations and their assessment of the quality of our loan portfolio, securities portfolio and other assets. Based on our regulators’ assessment of the quality of our assets, operations, lending practices, investment practices, capital structure or
33
other aspects of our business, we may be required to take additional charges or undertake, or refrain from taking, actions that could have an adverse effect on our business, financial condition and results of operations.
Monetary policies and regulations of the Federal Reserve could have an adverse effect on our business, financial condition and results of operations.
Our earnings and growth are affected by the policies of the Federal Reserve. An important function of the Federal Reserve is to regulate the money supply and credit conditions. Among the instruments used by the Federal Reserve to implement these objectives are open market purchases and sales of U.S. government securities, adjustments of the discount rate and changes in banks’ reserve requirements against bank deposits. These instruments are used in varying combinations to influence overall economic growth and the distribution of credit, bank loans, investments and deposits. Their use also affects interest rates charged on loans or paid on deposits.
The monetary policies and regulations of the Federal Reserve have had a significant effect on the operating results of commercial banks in the past and are expected to continue to do so in the future. The effects of such policies upon our business, financial condition and results of operations cannot be predicted.
Federal and state regulators periodically examine our business and may require us to remediate adverse examination findings or may take enforcement action against us.
The Federal Reserve, the FDIC and the DIFS periodically examine our business, including our compliance with laws and regulations. If, as a result of an examination, the Federal Reserve, the FDIC, or the DIFS were to determine that our financial condition, capital resources, asset quality, earnings prospects, management, liquidity or other aspects of any of our operations had become unsatisfactory, or that we were in violation of any law or regulation, they may take a number of different remedial actions as they deem appropriate. These actions may include requiring us to remediate any such adverse examination findings.
In addition, these agencies have the power to take enforcement action against us to enjoin “unsafe or unsound” practices, to require affirmative action to correct any conditions resulting from any violation of law or regulation or unsafe or unsound practice, to issue an administrative order that can be judicially enforced, to direct an increase in our capital, to direct the sale of subsidiaries or other assets, to limit dividends and distributions, to restrict our growth, to assess civil money penalties against us or our officers or directors, to remove officers and directors and, if it is concluded that such conditions cannot be corrected or there is imminent risk of loss to depositors, to terminate our deposit insurance and place our Bank into receivership or conservatorship. Any regulatory enforcement action against us could have an adverse effect on our business, financial condition and results of operations.
We are subject to stringent capital requirements, which could have an adverse effect on our operations.
Federal regulations establish minimum capital requirements for insured depository institutions, including minimum risk-based capital and leverage ratios, and defines “capital” for calculating these ratios. The capital rules require bank holding companies and banks to maintain a common equity Tier 1 capital to risk-weighted assets ratio of at least 7.0% (a minimum of 4.5% plus a capital conservation buffer of 2.5%), a Tier 1 capital to risk-weighted assets ratio of at least 8.5% (a minimum of 6.0% plus a capital conservation buffer of 2.5%), a total capital to risk-weighted assets ratio of at least 10.5% (a minimum of 8% plus a capital conservation buffer of 2.5%), and a leverage ratio of Tier 1 capital to total consolidated assets of at least 4.0%. An institution’s failure to exceed the capital conservation buffer with common equity Tier 1 capital would result in limitations on an institution’s ability to make capital distributions and discretionary bonus payments. In addition, for an insured depository institution to be “well-capitalized” under the banking agencies’ prompt corrective action framework, it must have a common equity Tier 1 capital ratio of at least 6.5%, Tier 1 capital ratio of at least 8.0%, a total capital ratio of at least 10.0%, and a leverage ratio of at least 5.0%, and must not be subject to any written agreement, order or capital directive, or prompt corrective action directive issued by its primary federal or state banking regulator to meet and maintain a specific capital level for any capital measure.
Any new or revised standards adopted in the future may require us to maintain materially more capital, with common equity as a more predominant component, or manage the configuration of our assets and liabilities to comply with formulaic capital requirements. We may not be able to raise additional capital at all, or on terms acceptable to us. Failure to maintain capital to meet current or future regulatory requirements could have an adverse effect on our business, financial condition and results of operations.
34
We are subject to numerous laws designed to protect consumers, including the CRA and fair lending laws, and failure to comply with these laws could lead to a wide variety of sanctions.
The CRA, the Equal Credit Opportunity Act, the Fair Housing Act and other fair lending laws and regulations prohibit discriminatory lending practices by financial institutions. The U.S. Department of Justice, federal banking agencies, and other federal agencies are responsible for enforcing these laws and regulations. A challenge to an institution’s compliance with fair lending laws and regulations could result in a wide variety of sanctions, including damages and civil money penalties, injunctive relief, restrictions on mergers and acquisitions activity, restrictions on expansion, and restrictions on entering new business lines. Private parties may also challenge an institution’s performance under fair lending laws in private class action litigation. Such actions could have a material adverse effect on our business, growth prospects, financial condition, and results of operations.
Additionally, the Consumer Financial Protection Board (the “CFPB”) was created under the Dodd-Frank Act to centralize responsibility for consumer financial protection with broad rulemaking authority to administer and carry out the purposes and objectives of federal consumer financial laws with respect to all financial institutions that offer financial products and services to consumers. The CFPB is also authorized to prescribe rules applicable to any covered person or service provider, identifying and prohibiting acts or practices that are “unfair, deceptive, or abusive” in connection with any transaction with a consumer for a consumer financial product or service, or the offering of a consumer financial product or service. The ongoing broad rulemaking powers of the CFPB have potential to have a significant impact on the operations of financial institutions offering consumer financial products or services.
We are subject to laws regarding the privacy, information security and protection of personal information and any violation of these laws or another incident involving personal, confidential, or proprietary information of individuals could damage our reputation and otherwise adversely affect our business.
Our business requires the collection and retention of large volumes of customer data, including personally identifiable information, or PII, in various information systems that we maintain and in those maintained by third-party service providers. We also maintain important internal company data such as PII about our employees and information relating to our operations. We are subject to complex and evolving laws and regulations governing the privacy and protection of PII of individuals (including customers, employees, and other third parties). For example, our business is subject to the Gramm-Leach-Bliley Act (the “GLB Act”), which, among other things: (i) imposes certain limitations on our ability to share nonpublic PII about our customers with nonaffiliated third parties; (ii) requires that we provide certain disclosures to customers about our information collection, sharing and security practices and afford customers the right to “opt out” of any information sharing by us with nonaffiliated third parties (with certain exceptions); and (iii) requires that we develop, implement and maintain a written comprehensive information security program containing appropriate safeguards based on our size and complexity, the nature and scope of our activities, and the sensitivity of customer information we process, as well as plans for responding to data security breaches. Various federal and state banking regulators and states have also enacted data breach notification requirements with varying levels of individual, consumer, regulatory or law enforcement notification in the event of a security breach.
Ensuring that our collection, use, transfer and storage of PII complies with all applicable laws and regulations can increase our costs. Furthermore, we may not be able to ensure that customers and other third parties have appropriate controls in place to protect the confidentiality of the information that they exchange with us, particularly where such information is transmitted by electronic means. If personal, confidential or proprietary information of customers or others were to be mishandled or misused (in situations where, for example, such information was erroneously provided to parties who are not permitted to have the information, or where such information was intercepted or otherwise compromised by third parties), we could be exposed to litigation or regulatory sanctions under privacy and data protection laws and regulations. Concerns regarding the effectiveness of our measures to safeguard PII, or even the perception that such measures are inadequate, could cause us to lose customers or potential customers and thereby reduce our revenues. Accordingly, any failure or perceived failure to comply with applicable privacy or data protection laws and regulations may subject us to inquiries, examinations and investigations that could result in requirements to modify or cease certain operations or practices or in significant liabilities, fines or penalties, and could damage our reputation and otherwise adversely affect our business, financial condition and results of operations.
We are a bank holding company and are dependent upon our Bank for cash flow, and our Bank’s ability to make cash distributions is restricted.
We are a BHC with no material activities other than activities incidental to holding the common stock of our Bank. Our principal source of funds to pay distributions on our common stock and service any of our obligations, other than further issuances of securities, is dividends received from our Bank. Furthermore, our Bank is not obligated to pay dividends to us, and
35
any dividends paid to us would depend on the earnings or financial condition of our Bank, various business considerations and applicable law and regulation. As is generally the case for banking institutions, the profitability of our Bank is subject to the fluctuating cost and availability of money, changes in interest rates and economic conditions in general. In addition, various federal and state statutes and regulations limit the amount of dividends that our Bank may pay to the Company without regulatory approval.
The Federal Reserve may require us to commit capital resources to support our Bank.
The Federal Reserve requires a BHC to act as a source of financial and managerial strength to its subsidiary banks and to commit resources to support its subsidiary banks. Under the “source of strength” doctrine that was codified by the Dodd-Frank Act, the Federal Reserve may require a BHC to make capital injections into a subsidiary bank at times when the BHC may not be inclined to do so and may charge the BHC with engaging in unsafe and unsound practices for failure to commit resources to such a subsidiary bank. Accordingly, we could be required to provide financial assistance to our Bank if it experiences financial distress.
A capital injection may be required at a time when our resources are limited, and we may be required to borrow the funds or raise capital to make the required capital injection. Any loan by a BHC to its subsidiary bank is subordinate in right of payment to deposits and certain other indebtedness of such subsidiary bank. In the event of a BHC’s bankruptcy, the bankruptcy trustee will assume any commitment by the holding company to a federal bank regulatory agency to maintain the capital of a subsidiary bank. Moreover, bankruptcy law provides that claims based on any such commitment will be entitled to a priority of payment over the claims of the holding company’s general unsecured creditors, including the holders of any note obligations. Thus, any borrowing by a BHC for the purpose of making a capital injection to a subsidiary bank may become more difficult and expensive relative to other corporate borrowings.
We face a risk of noncompliance and enforcement action with the Bank Secrecy Act and other anti-money laundering statutes and regulations.
The Bank Secrecy Act of 1970 (the “BSA”), the Uniting and Strengthening America by Providing Appropriate Tools Required to Intercept and Obstruct Terrorism Act of 2001 (the “Patriot Act”), and other laws and regulations require financial institutions, among other duties, to institute and maintain an effective anti-money laundering program and to file reports such as suspicious activity reports and currency transaction reports. We are required to comply with these and other anti-money laundering requirements. Our federal and state banking regulators, the U.S. Department of the Treasury Financial Crimes Enforcement Network (“FinCEN”), and other government agencies are authorized to impose significant civil money penalties for violations of anti-money laundering requirements. We are also subject to increased scrutiny of compliance with the regulations issued and enforced by the U.S. Department of the Treasury’s Office of Foreign Assets Control (OFAC), which is responsible for helping to ensure that U.S. entities do not engage in transactions with certain prohibited parties, as defined by various Executive Orders and Acts of Congress. If our program is deemed deficient, we could be subject to liability, including fines, civil money penalties and other regulatory actions, which may include restrictions on our business operations and our ability to pay dividends, restrictions on mergers and acquisitions activity, restrictions on expansion, and restrictions on entering new business lines. Failure to maintain and implement adequate programs to combat money laundering and terrorist financing could also have significant reputational consequences for us. Any of these circumstances could have an adverse effect on our business, financial condition and results of operations.
Our Bank’s FDIC deposit insurance premiums and assessments may increase.
Our Bank’s deposits are insured by the FDIC up to legal limits and, accordingly, our Bank is subject to insurance assessments based on our Bank’s average consolidated total assets less its average tangible equity. Our Bank’s regular assessments are determined by its CAMELS composite rating (a supervisory rating system developed to classify a bank’s overall condition by taking into account capital adequacy, assets, management capability, earnings, liquidity and sensitivity to market and interest rate risk), taking into account other factors and adjustments. In order to maintain a strong funding position and the reserve ratios of the DIF required by statute and FDIC estimates of projected requirements, the FDIC has the power to increase deposit insurance assessment rates and impose special assessments on all FDIC-insured financial institutions. Any future increases or special assessments could reduce our profitability and could have an adverse effect on our business, financial condition and results of operations.
36
The Company is an “emerging growth company” under the JOBS Act, and the Company cannot be certain whether the reduced disclosure requirements applicable to emerging growth companies will make the Company’s common stock less attractive to investors.
The Company is an “emerging growth company” under the Jumpstart Our Business Startups Act (the “JOBS Act”), and is, therefore, permitted to, and intends to, take advantage of certain exemptions from certain disclosure requirements. For so long as the Company remains an “emerging growth company,” the Company may take advantage of certain exemptions from various reporting requirements that are applicable to other public companies that are not “emerging growth companies,” including, but not limited to, not being required to comply with the auditor attestation requirements of Section 404 of the Sarbanes-Oxley Act of 2002, as amended, reduced disclosure obligations regarding executive compensation in the Company’s periodic reports and proxy statements and exemptions from the requirements of holding a nonbinding advisory vote on certain executive compensation matters, such as “say on pay” and “say on frequency.” As a result, the Company’s stockholders may not have access to certain information that they may deem important. Although the Company intends to rely on the exemptions provided in the JOBS Act, the exact implications of the JOBS Act for the Company are still subject to interpretations and guidance by the SEC and other regulatory agencies.
In addition, Section 107 of the JOBS Act provides that an “emerging growth company” can take advantage of the extended transition period provided in Section 7(a)(2)(B) of the Securities Act for complying with new or revised financial accounting standards. The Company has elected to delay the adoption of certain accounting standards until those standards would otherwise apply to private companies.
The Company cannot predict whether investors will find its common stock less attractive as a result of the Company taking advantage of these exemptions. If some investors find the Company’s common stock less attractive as a result of these choices, there may be a less active trading market for the Company’s common stock, and the Company’s stock price may be more volatile.
Risks Related an Investment in Our Common Stock
There is a limited trading market in the Company's common stock, which will hinder your ability to sell our common stock and may lower the market price of the stock.
Although the Company's common stock is traded on the New York Stock Exchange, there is currently a limited trading market for the Company's common stock. An active trading market for shares of the Company's common stock may never develop or be sustained. This limited trading market for the Company's common stock may reduce the market value of our common stock. Before investing in shares of the Company's common stock you should consider the limited trading market for our common stock and be financially prepared and able to hold your shares for an indefinite period.
Future sales of our common stock could depress the market price of our common stock.
As of February 18, 2025, there were 34,304,560 issued and outstanding shares of our common stock, which are freely transferable without restriction or further registration under the Securities Act. We, our executive officers, directors and certain of our holders of our outstanding shares of common stock holding, in the aggregate, 5,491,660 shares of our common stock as of October 31, 2024 (representing approximately 21.4% of our outstanding common stock as of such date), have agreed not to sell any shares of our common stock for a period of 180 days from the date of our initial public offering, subject to certain exceptions. Following the expiration of this lock-up period, all of these shares will be eligible for resale under Rule 144 of the Securities Act, subject to any remaining holding period requirements and, if applicable, volume limitations. Actual or anticipated issuances or sales of substantial amounts of our common stock following our initial offering could cause the market price of our common stock to decline significantly and make it more difficult for us to sell equity or equity-related securities in the future at a time and on favorable terms, or at all. We may issue all of these shares without any action or approval by our stockholders, and these shares, once issued (including upon exercise of outstanding options), will be available for sale into the public market, subject to the restrictions described in this report, if applicable, for affiliate holders. The market price for our common stock may decline significantly when the restrictions on resale by our existing stockholders lapse. A decline in the price of our common stock might impede our ability to raise capital through the issuance of additional common stock or other equity securities.
37
As of December 31, 2024, approximately 32.9% of our voting and non-voting common stock is owned by certain institutional holders, and future sales by these institutional holders may adversely affect the prevailing market price of our common stock.
On May 30, 2019, we sold 1,841,780 shares of our voting common stock and 3,972,180 shares of our non- voting common stock to Castle Creek Capital Partners VII, LP (“Castle Creek VII”). Additionally, on December 24, 2019 we sold 2,600,000 shares of our non-voting common stock to Castle Creek Capital Partners VI, LP (“Castle Creek VI,” and together with Castle Creek VII, “Castle Creek”). The non-voting common stock is non-voting in the hands of any holder of 9.9% or more of our voting common stock. Upon the sale or transfer of the non-voting stock in connection with a widely-distributed public offering or to an underwriter for purposes of a widely-distributed public offering, such transferred shares automatically will become an identical number of shares of voting common stock, as provided in our Amended and Restated Articles of Incorporation. As of March 21, 2025, Castle Creek continued to own 6,298,979 shares of common stock and non-voting common stock, representing approximately 18.36% of our issued and outstanding voting and non-voting common stock as of such date.
In connection with the transactions above, we entered into a Registration Rights with each of Castle Creek VII and Castle Creek VI (the “Registration Rights Agreements”). The Registration Rights Agreements provide for demand and piggyback registration rights. Pursuant to its demand registration rights, after May 30, 2024 and December 24, 2024, respectively, Castle Creek had the right to require the Company to file a registration statement with the SEC so that Castle Creek may resell its shares of common stock. If the Company files a registration statement for a primary or secondary offer of its securities (other than a registration statement related to equity compensation plans or mergers and acquisitions), the Registration Rights Agreements require the Company to notify Castle Creek, who may elect to have its securities included in such registration statement for resale.
In accordance with the Registration Rights Agreements, Castle Creek VII and Castle Creek VI acted as selling stockholders in our initial public offering and offered shares of common stock. To the extent that Castle Creek will continue to hold shares of common stock, it is possible that the Company may be required to register for resale shares of common stock of Castle Creek, and such resale could have adverse effect on volatility and the market value of the Company’s common stock then outstanding. Such resales could also make it more difficult for the Company and its stockholders to sell common stock.
We have existing investors that own a significant amount of our common stock whose individual interests may differ from yours.
A significant percentage of our common stock is currently held by Castle Creek. As of March 21, 2025, Castle Creek owned approximately 18.36%, of our outstanding shares of common stock. In addition to the registration rights described above, we have agreed to nominate one person designated by Castle Creek to our board of directors, subject to satisfaction of the legal and governance requirements regarding service as a member of our board of directors and to the reasonable approval of the Company, and to the board of directors of Northpointe Bank. We have also agreed that we will recommend to our stockholders that the Castle Creek representative is elected to our board of directors at all of the Company’s meetings of stockholder as which members of the board of directors are to be elected. In addition, subject to limited exceptions, we have agreed that, if at any time Castle Creek does not have a representative on our board of directors, to invite one person designated by Castle Creek to attend all meetings of our board of directors and all meetings of the board of directors of Northpointe Bank. These board representation and board observation rights will continue with respect to Castle Creek for so long as Castle Creek, together with its affiliates, continues to hold 4.9% or more of our issued and outstanding voting common stock. If Castle Creek ceases to hold the required ownership percentage, Castle Creek will no longer have any further board representation rights, and Castle Creek will use all reasonable best efforts to cause its board representative to promptly resign from our board of directors and from the board of directors of Northpointe Bank. Currently, John M. Eggemeyer III serves on our board of directors as the representative of Castle Creek. We have also agreed that, for so long as Castle Creek holds 4.9% or more of the voting common stock of the Company, Castle Creek will generally have the right to purchase its pro rata share of any securities that we may issue in the future. Such rights do not apply to certain transactions such as a mergers or issuances pursuant to an equity incentive plan approved by the board of directors (subject to certain limitations). Castle Creek also has certain indemnification, and information and access rights. Castle Creek will continue to have a significant level of influence over us because of Castle Creek’s common stock ownership and its board representation and observer rights. For example, Castle Creek will have a greater ability than our other shareholders to influence the election of directors and the potential outcome of other matters submitted to a vote of our shareholders, including mergers and other acquisition transactions, amendments to our Amended and Restated Articles of Incorporation and Amended and Restated Bylaws, and other extraordinary corporate matters. The interests of Castle Creek could conflict with the interests of our other shareholders, and any future transfer by these investors of their shares of common stock to other investors who have different business objectives could adversely affect our business, results of operations, financial condition, prospects or the market value of our common stock.
38
Our stock price may be volatile, and you could lose part or all of your investment as a result.
Stock price volatility may negatively impact the price at which our common stock may be sold, and may also negatively impact the timing of any sale. Our stock price may fluctuate widely in response to a variety of factors including the risk factors described herein and, among other things:
•actual or anticipated variations in quarterly or annual operating results, financial conditions or credit quality;
•changes in business or economic conditions;
•changes in accounting standards, policies, guidance, interpretations or principles;
•changes in recommendations or research reports about us or the financial services industry in general published by securities analysts;
•the failure of securities analysts to cover, or to continue to cover, us after this offering;
•changes in financial estimates or publication of research reports and recommendations by financial analysts or actions taken by rating agencies with respect to us or other financial institutions;
•news reports relating to trends, concerns and other issues in the financial services industry;
•reports related to the impact of natural or manmade disasters in our market;
•perceptions in the marketplace regarding us and or our competitors;
•sudden increases in the demand for our common stock, including as a result of any “short squeezes;”
•significant acquisitions or business combinations, strategic partnerships, joint ventures or capital commitments by or involving us or our competitors;
•additional investments from third parties;
•additions or departures of key personnel;
•future sales or issuance of additional shares of common stock;
•fluctuations in the stock price and operating results of our competitors;
•changes or proposed changes in laws or regulations, or differing interpretations thereof affecting our business, or enforcement of these laws or regulations;
•new technology used, or services offered, by competitors;
•additional investments from third parties; or
•geopolitical conditions such as acts or threats of terrorism, pandemics or military conflicts.
In particular, the realization of any of the risks described in this section could have an adverse effect on the market price of our common stock and cause the value of your investment to decline. In addition, the stock market in general has experienced extreme volatility that has often been unrelated to the operating performance of particular companies. These broad market fluctuations may adversely affect the trading price of our common stock over the short, medium or long term, regardless of our actual performance.
If securities or industry analysts do not publish research or publish inaccurate or unfavorable research about our business, our stock price and trading volume could decline.
The trading market for our common stock will depend in part on the research and reports that securities or industry analysts publish about us or our business. We may be unable to attract or sustain research coverage by securities and industry analysts. If no securities or industry analysts commence coverage of our company, the trading price for our stock would be negatively impacted. If we obtain securities or industry analyst coverage and if one or more of the analysts who covers us downgrades our stock or publishes inaccurate or unfavorable research about our business, our stock price would likely decline.
39
If we fail to meet the expectations of analysts for our operating results, our stock price would likely decline. If one or more of these analysts ceases coverage of us or fails to publish reports on us regularly, demand for our stock could decrease, which could cause our stock price and trading volume to decline.
We may not pay dividends on our common stock in the future, and our ability to pay dividends is subject to certain restrictions.
Holders of our common stock are entitled to receive only such dividends as our board of directors may declare out of funds legally available for such payments. Our board of directors may, in its sole discretion, change the amount or frequency of dividends or discontinue the payment of dividends entirely. In addition, we are a BHC, and our ability to declare and pay dividends is dependent on federal regulatory considerations, including the guidelines of the Federal Reserve regarding capital adequacy and dividends. It is the policy of the Federal Reserve that bank holding companies should generally pay dividends on common stock only out of earnings, and only if prospective earnings retention is consistent with the organization’s expected future needs, asset quality and financial condition, and that bank holding companies should inform and consult with the Federal Reserve in advance of declaring and paying a dividend that exceeds earnings for the period for which the dividend is being paid.
The holders of our debt obligations and preferred stock will have priority over our common stock with respect to payment in the event of liquidation, dissolution or winding up and with respect to the payment of interest and dividends.
In any liquidation, dissolution or winding up of the Company, our common stock would rank below all claims of debt holders against us as well as any preferred stock that has been issued. As of December 31, 2024, we had outstanding an aggregate of $43.9 million of subordinated notes, net of debt issuance costs, and we had outstanding an aggregate $103.6 million of non-cumulative perpetual preferred stock. We could incur such debt obligations or issue preferred stock in the future to raise additional capital. In such event, holders of our common stock will not be entitled to receive any payment or other distribution of assets upon the liquidation, dissolution or winding up of the Company until after all of our obligations to the debt holders are satisfied and holders of subordinated debt and senior equity securities, including preferred shares, if any, have received any payment or distribution due to them. In addition, we will be required to pay interest on the subordinated notes and dividends on the trust preferred securities and preferred stock before we will be able to pay any dividends on our common stock.
Michigan law and the provisions of our Amended and Restated Articles of Incorporation and Amended and Restated Bylaws may have an anti-takeover effect, and there are substantial regulatory limitations on changes of control of bank holding companies.
Michigan corporate law and provisions of our Amended and Restated Articles of Incorporation and our Amended and Restated Bylaws could make it more difficult for a third party to acquire us, even if doing so would be perceived to be beneficial by our stockholders. Furthermore, with certain limited exceptions, federal regulations prohibit a person or company or a group of persons deemed to be “acting in concert” from, directly or indirectly, acquiring 10% or more (5% or more if the acquirer is a BHC) of any class of our voting stock or obtaining the ability to control in any manner the election of a majority of our directors or otherwise direct the management or policies of our Company without prior notice or application to and the approval of the Federal Reserve. Accordingly, prospective investors must comply with these requirements, if applicable, in connection with any purchase of shares of our common stock. Collectively, provisions of our Amended and Restated Articles of Incorporation and Amended and Restated Bylaws and other statutory and regulatory provisions may delay, prevent or deter a merger, acquisition, tender offer, proxy contest or other transaction that might otherwise result in our stockholders receiving a premium over the market price for their common stock. Moreover, the combination of these provisions effectively inhibits certain business combinations, which, in turn, could adversely affect the market price of our common stock.
An investment in our common stock is not an insured deposit.
An investment in our common stock is not a bank deposit and, therefore, is not insured against loss by the FDIC, any other deposit insurance fund or by any other public or private entity. Investment in our common stock is inherently risky for the reasons described herein, and is subject to the same market forces that affect the price of common stock in any company. As a result, if you acquire our common stock, you could lose some or all of your investment.
The requirements of being a public company may strain our resources and divert management’s attention.
As a public company, we will incur additional legal, accounting, insurance and other expenses. We will be subject to the reporting requirements of the Exchange Act, the Sarbanes-Oxley Act and applicable securities rules and regulations. These laws and regulations increase the scope, complexity and cost of corporate governance, reporting and disclosure practices over those
40
of non-public or non-reporting companies. Despite our conducting business in a highly regulated environment, these laws and regulations have different requirements for compliance than we have experienced prior to becoming a public company. Among other things, the Exchange Act requires that we file annual, quarterly and current reports with respect to our business and operating results and maintain effective disclosure controls and procedures and internal control over financial reporting. As an NYSE listed company, we will be required to prepare and file proxy materials which meet the requirements of the Exchange Act and the SEC’s proxy rules. Compliance with these rules and regulations will increase our legal and financial compliance costs, make some activities more difficult, time-consuming or costly, and increase demand on our systems and resources, particularly after we are no longer an “emerging growth company” as defined in the JOBS Act. In order to maintain, appropriately document and, if required, improve our disclosure controls and procedures and internal control over financial reporting to meet the standards required by the Sarbanes-Oxley Act, additional resources and management oversight may be required. As a result, management’s attention may be diverted from other business concerns, which could harm our business and operating results. Additionally, any failure by us to file our periodic reports with the SEC in a timely manner could harm our reputation and cause our investors and potential investors to lose confidence in us, and restrict trading in, and reduce the market price of, our common stock, and potentially our ability to access the capital markets.
Item 1B. Unresolved Staff Comments
None
Item 1C. Cybersecurity
Cybersecurity Risk Management and Strategy
The information security program performs periodic risk assessments of our information systems and cybersecurity threats using industry standard methodologies based on FFIEC Cybersecurity Assessment Tool (CAT), as well as regulatory guidance issued by the Federal Financial Institutions Examination Council (FFIEC) and state and federal regulators, including the Federal Deposit Insurance Corporation and the Michigan Department of Insurance and Financial Services. Based on risk, our information security program performs internal engagements to provide assurance to senior management and the Board that our information systems are able to identify, escalate and mitigate cybersecurity threats on a routine basis. We also engage external independent parties to perform independent audit engagements, as well as other assessments of our information security and third-party risk management program and information systems.
We are exposed to cybersecurity threats and incidents that can range from uncoordinated individual attempts to gain unauthorized access to information systems to sophisticated and targeted measures known as advanced persistent threats, directed at the Company or its third-party service providers. While we have experienced, and expect to continue to experience,
41
cybersecurity threats, we have not experienced a material cybersecurity incident in the two-year period ended December 31, 2024. The potential consequences of a material cybersecurity incident could include reputational damage, litigation with third parties, regulatory scrutiny or proceedings and increased cybersecurity protection and remediation costs, which in turn could materially adversely affect our results of operations. We evaluate the risks of data theft (including theft of sensitive, proprietary and other data categories, in addition to personal data), and harm to customer or third-party relationships or the possibility of litigation or regulatory investigation or actions that could materially adversely affect our results of operations and our reputation. Please see Part I, Item 1A Risk Factors for further discussion of the risks associated with an interruption or breach in our information systems or infrastructure.
Cybersecurity Governance
An Information Technology Steering Committee was established to assist Management and the Board of Directors in the oversight and risk management of information security. This Committee is responsible for updates which summarize cybersecurity threats and incident monitoring activity, along with details of remediation to address threats and incidents. The summary considers both internal as well as external threat events and outlines management’s approach to enable the timely identification and notice of a material incident, should one occur, without unreasonable delay.
The Board of Directors receives periodic training related to cyber security and is responsible for approval and oversight of management’s policies governing information system security and cybersecurity threats and incidents, as well as oversight of management’s approach to secure our information systems. The Board of Directors delegates the primary oversight of risk management to the Bank’s Audit Committee .
Potential cybersecurity incidents are reviewed by the Chief Information Security Officer and the Information Technology Steering Committee . The evaluation of reported events by the committee includes reporting of any mitigation or remediation determined necessary to address the threat posed by the reported event. If any event rose to the level of a material incident, management maintains an incident response plan to mitigate the impact, maintain business continuity and provide for internal and external communication, including required notifications.
Our Chief Information Security Officer has over 25 years of relevant experience and formal training in the areas of cybersecurity, risk management, and data privacy in the financial services industry. The Chief Information Security Officer holds a Master of Science in Computer Information Systems and appropriate professional certifications.
Item 2. Properties
Our principal executive office is located at 3333 Deposit Drive Northeast, Grand Rapids, Michigan 49546 and our telephone number at that address is (616) 940-9400. In addition to our principal executive office, we operate loan production offices across 23 cities in 15 states that are supported through our centralized operating center in Grand Rapids, Michigan. We believe that our properties are in good condition and are suitable and adequate to our needs.
Item 3. Legal Proceedings
We are subject to various legal actions that arise from time to time in the ordinary course of business. While the ultimate outcome of pending procedures cannot be predicted with certainty, at this time management does not expect that any such proceedings, either individually or in the aggregate, would have a material adverse effect on our consolidated financial position or results of operations. However, one or more unfavorable outcomes in any legal action against us could have a material adverse effect for the period in which they are resolved. In addition, regardless of their merits or their ultimate outcomes, such matters are costly, divert management’s attention and may materially adversely affect our reputation, even if resolved in our favor.
42
Item 4. Mine Safety Disclosures
Not applicable.
43
Part II
Item 5. Market for Registrant's Common Equity, Related Stockholder Matters and Issuer Purchases of Equity Securities
Beginning February 14, 2025, our common stock was quoted on the New York Stock Exchange under the symbol NPB.
On March 28, 2025, there were approximately 87 owners of record of our common stock.
The following graph shows the cumulative total stockholder return (including the reinvestment of dividends) on an investment in the Company’s common stock compared to the Russell 2000 Index and the KBW Regional Banking Index. The comparison assumes a $100 investment on February 17, 2025 at the initial price of $14.50 set in the Company’s initial public offering and through March 18, 2025 (30 days). The comparisons in this table are set forth in response to Securities and Exchange Commission (SEC) disclosure requirements and therefore are not intended to forecast or be indicative of future performance of the common stock.
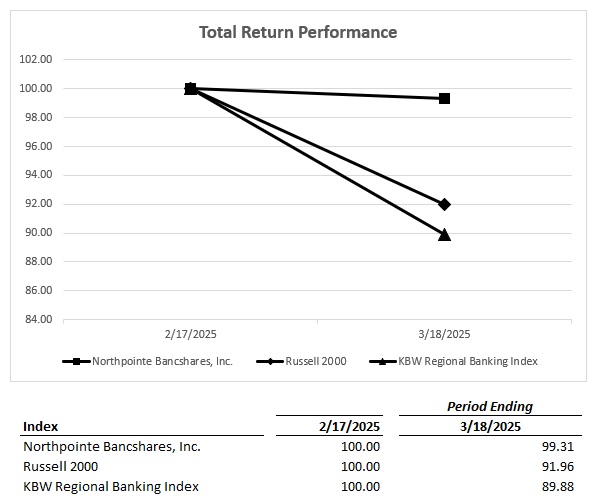
Dividends
We have no obligation to pay dividends and we may change our dividend policy at any time without notice to our stockholders. Any future determination to pay dividends to holders of our common stock will depend on our results of operations, financial condition, capital requirements, banking regulations, contractual restrictions and any other factors that our board of directors may deem relevant.
We are subject to certain restrictions on the payment of cash dividends as a result of banking laws, regulations and policies. Information on restrictions on payments of dividends by us may be found in Item 1 of this report under the heading “Supervision and Regulation” and is here incorporated by reference.
Equity Compensation Plan Information
Please see Item 12 of this Annual Report for information with respect to shares of common stock that are authorized for issuance under the Company’s equity compensation plans as of December 31, 2024. Such information is incorporated herein by reference.
Issuer Purchases of Equity Securities
None.
Item 6. [ Reserved ]
44
Item 7. Management's Discussion and Analysis of Financial Condition and Results of Operations
The following discussion and analysis of our financial condition and results of operations should be read in conjunction with our consolidated financial statements and related notes included elsewhere in this Annual Report on Form 10-K. This discussion and analysis contains forward-looking statements that involve risk, uncertainties and assumptions. Certain risks, uncertainties and other factors, including but not limited to those set forth under “Cautionary Note Regarding Forward-Looking Statements,” “Risk Factors,” and elsewhere in this Annual Report on Form 10-K, may cause actual results to differ materially from those projected in the forward looking statements. We assume no obligation to update any of these forward-looking statements.
Unless otherwise stated, all information in this document gives effect to a ten-for-one stock split, whereby each holder of our common stock received nine additional shares of common stock for each share owned as of the record date of December 19, 2024, which was distributed on December 30, 2024. The effect of the stock dividend on outstanding shares and per share figures has been retroactively applied to all periods presented in this document.
Business Overview
The Company is a bank holding company that is headquartered in Grand Rapids, Michigan. Through our wholly-owned subsidiary, Northpointe Bank, we focus on providing independent mortgage banking platforms nationwide with an alternative to traditional mortgage warehouse lending (we refer to this business as our Mortgage Purchase Program, or “MPP”, as well as residential mortgage and digital banking services to retail customers nationwide. Our residential lending business provides a comprehensive range of financing options nationwide through two main channels: consumer direct and traditional retail. These channels combine the convenience of on-line, self-service platforms with the personalized service of an experienced residential mortgage loan officer. Both residential mortgage loan origination channels are supported by our proprietary POS digital platform that streamlines the loan application and closing processes. Our consumer direct and traditional retail channels primarily originate mortgage loans which are saleable through an end investor. In addition, our traditional retail channel selectively originates first-lien home equity lines which are tied seamlessly to a demand deposit sweep account (we refer to the loans we originate as “All-in-One” or “AIO” loans). We have one bank branch located in Grand Rapids, Michigan and loan production offices located in 23 cities in 15 states across the country, which are supported by our centralized operations and back-office support teams based in Grand Rapids, Michigan.
Our results of operations are driven by a combination of net interest income, which is the difference between interest income from interest-earning assets and interest expense on interest-bearing liabilities, as well as fee income from a variety of sources. Key components of noninterest income include gains from the sale of newly originated loans, loan servicing fees, and service charges from our deposit services and our MPP and residential lending businesses. Our principal operating expense, aside from interest expense, consists of salaries and employee benefits, including commissions paid to loan originators, occupancy and equipment costs, data processing expense, professional fees, and provisions for credit losses. Our income is affected by regulatory, economic, and competitive factors that influence interest rates, residential loan demand and deposits costs. In addition, we are subject to interest rate risk to the degree that our interest-earnings assets mature or reprice at different times or at different speeds than our interest-bearing liabilities.
Critical Accounting Policies and Estimates
Our consolidated financial statements are prepared in accordance with United States generally accepted accounting principles (“GAAP”) and follow general practices within the banking industry. Application of these principles requires management to make estimates, assumptions and complex judgements that affect amounts presented in our consolidated financial statements. These estimates, assumptions and judgements are based on information available as of the date of the financial statements; accordingly, as this information changes, the consolidated financial statements could reflect different estimates, assumptions, and judgements.
Our accounting and reporting policies are in accordance with accounting principles generally accepted in the United States of America and conform to general practices within the banking industry. Accounting and reporting policies for the allowance for credit losses (“ACL”), lender risk account and capitalized mortgage loan servicing rights are deemed critical since they involve the use of estimates and require significant management judgments. Application of assumptions different than those that we have used could result in material changes in our financial position or results of operations.
Our methodology for determining the ACL and related provision for credit losses is described later in this section under “Provision for Credit Losses” and “Loan Portfolio”. In particular, this area of accounting requires a significant amount of
45
judgment because a multitude of factors can influence the ultimate collection of a loan or other type of credit. It is extremely difficult to precisely measure the amount of expected credit losses in our loan portfolio. We use a rigorous process to attempt to accurately quantify the necessary ACL and related provision for credit losses, but there can be no assurance that our modeling process will successfully identify all of the expected credit losses in our loan portfolio. The assumptions around establishing reasonable and supportable economic forecasts are particularly subjective. As a result, we could record future provisions for credit losses that may be significantly different than the levels that we recorded in prior periods. See also Note 2 and Note 3 to the Consolidated Financial Statements included within this report for further discussion on ACL.
A Lender Risk Account (“LRA”) has been established for loans we have sold to the Federal Home Loan Bank of Indianapolis (“FHLB”). The LRA is funded and maintained by the FHLB at 1.20% of the loan balance and is used to offset credit losses over the life of the loans sold to the FHLB. If the LRA has not been depleted by losses, funds are returned to the Company over time, beginning after five years and continuing through 25 years. We carry the asset at estimated fair value. Fair value is determined using an income approach with various assumptions including expected cash flows, market discount rates, prepayment speeds, and other factors. These assumptions are particularly subjective and can have a material effect on the estimated LRA balance and income. We believe the assumptions that we utilize in estimating fair value are reasonable based upon accepted industry practices and represent neither the most conservative or aggressive assumptions. See also Note 2 and Note 18 for further discussion of the LRA and the methods used to determine fair value of the LRA.
We establish mortgage servicing right assets when we sell loans with servicing retained and when we purchase mortgage servicing. The fair value of our mortgage loan servicing rights has been determined based on a valuation model used by an independent third party. There are several critical assumptions involved in establishing the value of this asset including estimated future prepayment speeds on the underlying mortgage loans, the interest rate used to discount the net cash flows from the mortgage loan servicing, the estimated amount of ancillary income that will be received in the future (such as late fees) and the estimated cost to service the mortgage loans. We believe the assumptions that we utilize in our valuation are reasonable based upon accepted industry practices for valuing mortgage loan servicing rights and represent neither the most conservative or aggressive assumptions. See also Note 2, Note 5 and Note 18 for further discussion of MSR activity and fair value estimation.
Emerging Growth Company
Pursuant to the JOBS Act, as an emerging growth company, we can elect to opt out of the extended transition period for adopting any new or revised accounting standards. We have elected to take advantage of the extended transition period, which means that when a standard is issued or revised and it has different application dates for public or private companies, we may adopt the standard on the application date for private companies. We have elected to take advantage of the scaled disclosures and other relief under the JOBS Act, and we may take advantage of some or all of the reduced regulatory and reporting requirements that will be available to us under the JOBS Act, so long as we qualify as an emerging growth company.
Primary Factors Used to Evaluate our Business
In addition to net income, the primary factors we use to evaluate and manage our results of operations include net interest income, noninterest income and noninterest expense.
Net Interest Income
Net interest income is generally the most significant contributor to our net income. Net interest income represents interest income from interest earning assets, primarily our loan portfolio, including MPP, residential mortgage loans, and our first lien home equity product AIO Loans, as well as interest earned on our liquid assets primarily invested at the Federal Reserve and FHLB dividends, less interest expense on interest-bearing liabilities, such as deposits, FHLB advances, and other borrowings, which are used to fund those assets. The amount of our net income is affected by overall loan demand, economic conditions, the slope of the yield curve, and changes in the absolute level of interest rates, the amounts and composition of our loan portfolio and interest-bearing liabilities.
For 2024 and 2023, net interest income accounted for more than half of our total revenue. During periods when market conditions are such that industry residential loan originations are significantly higher, such as in 2020 and 2021, it is expected that noninterest income will grow substantially, driven primarily by gain on sale of mortgage loans, resulting in net interest income dropping to under half of total revenue.
46
Noninterest Income
Noninterest income consists of service charges on deposits and related fees, loan servicing fees, MPP related fees, and net gains on the sale of loans. Noninterest income is a key contributor to our net income and is expected to account for more than half of our revenue in market conditions when industry residential mortgage loan origination volumes are significantly higher, such as in 2020 and 2021.
Noninterest Expense
Noninterest expense includes salaries and employee benefits, occupancy and equipment costs, data processing expense, professional fees, and other taxes and insurance and other noninterest expense. In evaluating our level of noninterest expense, we also monitor our efficiency ratio. As a residential real estate mortgage-focused bank, our efficiency ratio will typically be higher than other non-mortgage focused banks and will tend to decrease significantly with any meaningful increase in industry mortgage originations. The efficiency ratio represents non-interest expense divided by the sum of net interest income and noninterest income.
We continually seek to identify ways to streamline our business and operate more efficiently, which has enabled us to reduce our noninterest expense in both absolute terms and as a percentage of our revenue while continuing to achieve growth in total loans and assets. A large component of our expense base is mortgage- related commissions, which are variable in nature and increase or decrease in line with residential mortgage originations. We also proactively manage our production-related back-office expenses and will right size those expenses based on the anticipated level of production.
Over the past several years, we have continued to invest in growth strategies and resources, including personnel, technology and infrastructure. We believe we are well positioned to continue our growth trajectory without meaningful additions to our current cost structure.
Public Company Costs
We completed our initial public offering in February 2025. As a result, we expect to incur additional costs associated with operating as a public company. We expect that these costs will include additional personnel, legal, consulting, regulatory, insurance, accounting, investor relations and other expenses that we did not incur as a private company.
The Sarbanes-Oxley Act, as well as rules adopted by the SEC, the FDIC, and NYSE, requires public companies to implement specified corporate governance practices that were previously inapplicable to us as a private company. These additional rules and regulations will increase our legal, regulatory and financial compliance costs and will make some activities more time-consuming and costly.
Financial Condition
The primary factors we use to evaluate and manage our financial condition include asset quality, liquidity and capital.
Asset Quality
We manage the quality of our loans based upon trends at the overall loan portfolio level as well as within specific product types. We measure and monitor key factors that include the level and trend of classified, delinquent, nonaccrual and nonperforming assets, collateral coverage and credit scores and debt service coverage, where applicable. These metrics directly impact our evaluation of the adequacy of our allowance for credit losses.
Liquidity
We manage liquidity based upon factors that include the level of diversification of our funding sources, the composition and duration of our deposits, the availability of unused funding sources, off-balance sheet obligations, the amount of cash we hold and the availability of assets to be readily converted into cash without undue loss. Our liquidity position benefits significantly from the fact that approximately one-third of the loan portfolio is in MPP, in which loans typically have a dwell time on the client’s facility for less than 30 days after the loan is funded, and which we have the unilateral right not to fund. We maintain appropriate funding capacity through our diversified and nimble funding structure, which includes a scalable digital banking platform, non-brokered rate board time deposits, brokered CDs, and access to funding from the FHLB and other smaller facilities. The FDIC evaluates the liquidity of our Bank on a stand-alone basis pursuant to applicable guidance and policies.
47
Capital
We manage our capital by tracking the level and quality of capital with consideration given to our overall financial condition, our asset quality, our level of allowance for credit losses, our geographic and industry concentrations, and other risk factors in our balance sheet, including interest rate sensitivity and off-balance-sheet commitments. Bank holding companies and banks are subject to various regulatory capital requirements administered by federal bank and state regulatory agencies. Our Bank is subject to minimum risk-based and leverage capital requirements under federal regulations implementing the Basel III framework, and to regulatory thresholds that must be met for an insured depository institution to be classified as “well-capitalized” under the prompt corrective action framework. Our capital ratios and the capital ratios of our Bank at December 31, 2024 exceeded all applicable minimum capital requirements and the regulatory standards for our Bank to be “well- capitalized.”
Highlights of 2024 Financial Results (compared to 2023)
Our net income for the year ended December 31, 2024 compared to December 31, 2023 demonstrates our success in strategic repositioning over the past several years.
•Net income available to common stockholders for 2024 was $47.2 million, an increase of $23.1 million, nearly double our net income of $24.1 million in 2023.
•Despite lower residential mortgage originations over the same period, net income available to common stockholders increased by 95.6% compared to year-end 2023, attributable to higher net interest income and lower noninterest expense, which more than offset the decrease in noninterest income.
•We did not incur any material one-time costs associated with strategic repositioning in 2024.
•Net interest income before provision increased by $13.0 million in 2024 compared to 2023, reflecting strong growth in MPP and AIO loans and a 4 basis point improvement in net interest margin.
•Noninterest expense decreased by $38.5 million, or 25.1%, in 2024, compared to 2023, primarily driven by lower variable compensation and our proactive measures to manage mortgage-related back-office expenses.
•We continued to thoughtfully change the mix of our HFI loan portfolio.
•MPP loans increased to 36.8% of total gross loans at December 31, 2024, from 27.7% at December 31, 2023.
•Residential mortgage loans decreased to 41.9% of total gross loans at December 31, 2024 from 45.1% at December 31, 2023.
•AIO Loans were 13.2% of total gross loans at December 31, 2024, up from 12.2% at December 31, 2023.
•MPP facilities increased by $564.0 million, or 49.2%, at December 31, 2024 compared to December 31, 2023, reflecting strong new customer acquisition and market share gains, as well as a slight increase in overall industry mortgage originations.
•Liquidity remained stable, with total cash and cash equivalents of $376.3 million at December 31, 2024, compared to $351.9 million at December 31, 2023.
•As of December 31, 2024, our capital ratios were above all regulatory requirements to be considered well-capitalized.
48
Results of Operations
Net Interest Income
The following table presents average balance sheet information, interest income, interest expense and the corresponding average yield earned and rates paid for the years ended December 31, 2024 and 2023:
| (Dollars in thousands) | For the Years Ended December 31, | ||||||||||||||||||||||||||||||||||
| 2024 | 2023 | ||||||||||||||||||||||||||||||||||
| Average Balance |
Interest Inc/Exp |
Average Yield/Rate |
Average Balance |
Interest Inc/Exp |
Average Yield/Rate |
||||||||||||||||||||||||||||||
| Interest-Earning Assets | |||||||||||||||||||||||||||||||||||
Loans(1)(2)
|
$ | 4,427,420 | $ | 285,490 | 6.45 | % | $ | 3,932,840 | $ | 237,396 | 6.04 | % | |||||||||||||||||||||||
Securities, AFS(3)
|
9,819 | 637 | 6.49 | % | 16,117 | 923 | 5.73 | % | |||||||||||||||||||||||||||
| Securities, FHLB Stock | 69,243 | 6,399 | 9.24 | % | 71,627 | 4,191 | 5.85 | % | |||||||||||||||||||||||||||
| Interest Bearing Deposits | 476,288 | 25,006 | 5.25 | % | 482,246 | 24,872 | 5.16 | % | |||||||||||||||||||||||||||
| Total Earning Assets | 4,982,770 | 317,532 | 6.37 | % | 4,502,830 | 267,382 | 5.94 | % | |||||||||||||||||||||||||||
Noninterest Earning Assets(4)
|
138,653 | 200,113 | |||||||||||||||||||||||||||||||||
| Total Assets | $ | 5,121,423 | $ | 4,702,943 | |||||||||||||||||||||||||||||||
| Interest-Bearing Liabilities | |||||||||||||||||||||||||||||||||||
| Deposits: | |||||||||||||||||||||||||||||||||||
| Transaction Accounts | $ | 412,396 | $ | 19,911 | 4.83 | % | $ | 233,199 | $ | 11,974 | 5.13 | % | |||||||||||||||||||||||
| Money Market & Savings | 380,131 | 16,691 | 4.39 | % | 434,395 | 15,705 | 3.62 | % | |||||||||||||||||||||||||||
| Time | 2,221,123 | 114,523 | 5.16 | % | 2,044,351 | 96,226 | 4.71 | % | |||||||||||||||||||||||||||
| Total Interest-bearing deposits | 3,013,650 | 151,125 | 5.01 | % | 2,711,945 | 123,905 | 4.57 | % | |||||||||||||||||||||||||||
| Sub Debt | 41,557 | 3,886 | 9.35 | % | 53,418 | 4,562 | 8.54 | % | |||||||||||||||||||||||||||
| Borrowings | 1,310,330 | 48,306 | 3.69 | % | 1,157,969 | 37,696 | 3.26 | % | |||||||||||||||||||||||||||
| Total Interest-bearing liabilities | 4,365,537 | 203,317 | 4.66 | % | 3,923,332 | 166,163 | 4.24 | % | |||||||||||||||||||||||||||
| Noninterest-bearing liabilities | |||||||||||||||||||||||||||||||||||
| Noninterest-bearing deposits | 250,135 | 286,569 | |||||||||||||||||||||||||||||||||
| Other noninterest-bearing liabilities | 54,130 | 65,392 | |||||||||||||||||||||||||||||||||
| Total noninterest-bearing liabilities | 304,265 | 351,961 | |||||||||||||||||||||||||||||||||
| Equity | 451,621 | 427,650 | |||||||||||||||||||||||||||||||||
| $ | 5,121,423 | $ | 4,702,943 | ||||||||||||||||||||||||||||||||
Net Interest Spread(5)
|
1.72 | % | 1.70 | % | |||||||||||||||||||||||||||||||
Net Interest Margin(6)
|
$ | 114,215 | 2.29 | % | $ | 101,219 | 2.25 | % | |||||||||||||||||||||||||||
____________________
(1)Loan balance includes loans held for investment and held for sale. Nonaccrual loans are included in total loan balances and no adjustment has been made for these loans in the yield calculation. Interest income on loans includes amortization of deferred loan fees, net of deferred loan costs.
(2)Loan fees of $303,000 and $241,000 for 2024 and 2023, respectively, are included in interest income.
(3)Average yield based on carrying value and there are no tax-exempt securities in the portfolio.
(4)Noninterest-earning assets includes the allowance for credit losses.
(5)Net interest spread is the average yield on total interest-earning assets minus the average rate on total interest-bearing liabilities.
(6)Net interest margin is net interest income divided by total interest-earning assets.
For the year ended December 31, 2024, net interest income increased to $114.2 million, an increase of $13.0 million, or 12.8%, from $101.2 million for the year ended December 31, 2023. This increase was due to the combined impact of a 10.7%
49
increase in earning assets to $4.98 billion from $4.50 billion, and an increase in net interest margin from 2.25% in 2023 to 2.29% in 2024. The increase in net interest margin was driven primarily by a higher mix of MPP facilities and AIO loans.
Yield and Volume Impact on Net Interest Income
Increases and decreases in interest income and interest expense result from changes in average balances (volume) of interest-earning assets and interest-bearing liabilities, as well as changes in average interest rates. The following table shows the effect that these factors had on the interest earned from our interest-earning assets and interest incurred on our interest-bearing liabilities. The effect of changes in volume is determined by multiplying the change in volume by the current period’s average rate. The effect of rate changes is calculated by multiplying the change in average rate by the previous period’s volume. The change in interest due to both rate and volume has been allocated to rate and volume changes in proportion to the relationship of the absolute dollar amounts of the changes in each.
| For the Years Ended December 31, | |||||||||||||||||||||||||||||||||||
| 2024 vs 2023 | |||||||||||||||||||||||||||||||||||
| Variance Due To | |||||||||||||||||||||||||||||||||||
| (Dollars in thousands) | Volume | Yield/Rate | Total | ||||||||||||||||||||||||||||||||
| Interest-Earning Assets | |||||||||||||||||||||||||||||||||||
| Loans | $ | 29,854 | $ | 18,240 | $ | 48,094 | |||||||||||||||||||||||||||||
| Securities, AFS | (361) | 75 | (286) | ||||||||||||||||||||||||||||||||
| Securities, FHLB Stock | (139) | 2,347 | 2,208 | ||||||||||||||||||||||||||||||||
| Interest-Bearing Deposits | (307) | 441 | 134 | ||||||||||||||||||||||||||||||||
| Total Interest-Earning Assets | 29,047 | 21,103 | 50,150 | ||||||||||||||||||||||||||||||||
| Interest-Bearing Liabilities | |||||||||||||||||||||||||||||||||||
| Deposits: | |||||||||||||||||||||||||||||||||||
| Transaction Accounts | 9,202 | (1,265) | 7,937 | ||||||||||||||||||||||||||||||||
| Money Market & Savings | (1,962) | 2,948 | 986 | ||||||||||||||||||||||||||||||||
| Time | 8,321 | 9,976 | 18,297 | ||||||||||||||||||||||||||||||||
| Total Interest-Bearing Deposits | 15,561 | 11,659 | 27,220 | ||||||||||||||||||||||||||||||||
| Sub Debt | (1,013) | 337 | (676) | ||||||||||||||||||||||||||||||||
| Borrowings | 4,960 | 5,650 | 10,610 | ||||||||||||||||||||||||||||||||
| Total Interest-Bearing liabilities | 19,508 | 17,646 | 37,154 | ||||||||||||||||||||||||||||||||
| Net Interest Income / Margin | $ | 9,539 | $ | 3,457 | $ | 12,996 | |||||||||||||||||||||||||||||
The yield and volume table above shows that the $13.0 million increase in net interest margin for 2024, compared to 2023, was due to a $9.5 million benefit from increased earnings asset volume as well as a $3.5 million increase in net interest margin as yields on assets grew more than our cost of funds in 2024. The primary driver of our growth in net interest income in 2024 was our loan portfolio. Total interest income on our loan portfolio grew $48.1 million in 2024, with $29.9 million coming from growth in average portfolio balances and $18.2 million from higher loan portfolio yields. Offsetting this interest income growth was higher funding costs, primarily time deposits and borrowings. Total funding costs increased by $37.2 million in 2024, with $19.5 million of the increase in interest expense coming from higher average balances and $17.6 million from higher funding rates. Overall, these dynamics allowed for an increase of 4 basis points in our net interest margin from 2.25% in 2023 to 2.29% in 2024.
Provision for Credit Losses
The provision for credit losses represents a charge to earnings necessary to establish an allowance for credit losses that, in management’s evaluation, is adequate to provide coverage for all expected future credit losses. The provision for credit losses is impacted by inherent risk characteristics in our loan portfolio, the level of nonperforming loans and net charge-offs, both current and historic, recent historical and projected future economic conditions, loan growth, the direction of the change in collateral values, and the level of actual net charge-offs incurred. Our provision for credit losses reflect risks in the HFI loan portfolio, which is comprised predominately of collateralized single-family mortgage loans, with very low historical loss experience.
In 2024, our total provision for credit losses was a benefit of $328,000 compared to a total benefit of $1.5 million in 2023. Our provision for credit losses reflects both our held for investment loan portfolio and the unfunded commitments on that
50
portfolio. The provision for credit losses related to loans was an expense of $881,000 for 2024, reflecting net charge-offs of $2.0 million and an ending allowance for credit losses of $11.2 million. For 2023, the provision for credit losses related to loans was a benefit of $2.6 million, reflecting $808,000 in net charge-offs and an ending allowance for credit losses of $12.3 million. Provision for credit losses also includes provision for unfunded loan commitments on the Consolidated Statements of Income. We recorded a provision for unfunded loan commitments benefit of $1.2 million for 2024 and an expense of $1.1 million for 2023, which impacted the change in allowance for each year.
On January 1, 2023, we adopted ASU 2016-13, Financial Instruments — Credit Losses: Measurement of Credit Losses on Financial Instruments, which replaced the incurred loss methodology with an expected loss methodology that is referred to as the current expected credit loss (“CECL”). The impact of our adoption of CECL on January 1, 2023 increased our allowance for credit losses on portfolio loans by $9.3 million and allowance on unfunded loan commitments by $508,000.
Noninterest income
The following table presents the major components of our noninterest income for the years ended December 31, 2024 and 2023:
| (Dollars in thousands) Noninterest Income |
For the years ended | $ Increase (Decrease) | ||||||||||||||||||
| 2024 | 2023 | |||||||||||||||||||
| Service charges on deposits and other fees | $ | 1,813 | $ | 2,669 | $ | (856) | ||||||||||||||
| Loan servicing fees | 8,876 | 10,304 | (1,428) | |||||||||||||||||
| MPP fees | 5,418 | 3,584 | 1,834 | |||||||||||||||||
| Net gain on sale of loans | 56,688 | 77,977 | (21,289) | |||||||||||||||||
| Other noninterest income | 128 | 533 | (405) | |||||||||||||||||
| $ | 72,923 | $ | 95,067 | $ | (22,144) | |||||||||||||||
Noninterest income declined by $22.1 million between 2024 and 2023, driven primarily by lower net gains on sales of loans and lower loan servicing fees, partially offset by higher MPP fees. During 2024, total residential mortgage volume decreased by $1.1 billion from the 2023 level. This was primarily attributable to a significant reduction in retail loan production offices as part of the Company’s strategic repositioning efforts. Over the same time period, we scaled our operating expenses accordingly such that the decrease in our noninterest income has been more than offset by lower noninterest expense.
The following tables present the major components of our loan servicing fees and net gain on sale of loans for the years ended December 31, 2024 and 2023:
| (Dollars in thousands) Loan Servicing Fees |
For the years ended | $ Increase (Decrease) | ||||||||||||||||||
| 2024 | 2023 | |||||||||||||||||||
| Fees on servicing | $ | 12,183 | $ | 24,321 | $ | (12,138) | ||||||||||||||
| Change in fair value of MSRs (1) | (3,307) | (14,017) | 10,710 | |||||||||||||||||
| $ | 8,876 | $ | 10,304 | $ | (1,428) | |||||||||||||||
| (1) - Includes change in fair value and paid in full MSRs. | ||||||||||||||||||||
| (Dollars in thousands) Net Gain on Sale of Loans |
For the years ended | $ Increase (Decrease) | ||||||||||||||||||
| 2024 | 2023 | |||||||||||||||||||
| Capitalized MSRs | $ | 5,004 | $ | 4,842 | $ | 162 | ||||||||||||||
| Change in fair value of loans (1) | 9,567 | (3,678) | 13,245 | |||||||||||||||||
| Gain on sale of loans, net (2) | 42,117 | 76,813 | (34,696) | |||||||||||||||||
| $ | 56,688 | $ | 77,977 | $ | (21,289) | |||||||||||||||
(1) - Includes the change in fair value of interest rate locks, loans held for sale, and held for investment.
(2) - Includes (a) net gain on sale of loans, (b) loan origination fees, points and costs, (c) provision from investor reserves, (d) gain or loss from forward commitments from hedging, and (e) fair value of lender risk account.
51
Loan servicing fees decreased by $1.4 million in 2024 compared to 2023 due largely to our bulk sale of mortgage servicing assets in the first quarter of 2024 totaling $80.8 million as we made the strategic decision to scale back that part of our business.
MPP fees increased by $1.8 million in 2024 compared to 2023 due to the increase in volume of our MPP program business in 2024.
Gain on sale of loans decreased by $21.3 million in 2024 compared to 2023. As shown in the table above, we had a favorable change in fair value adjustments on loans of $13.2 million during 2024. This was more than offset by the $34.7 million decrease in gain on sale of loans, which is primarily attributable to the decrease in saleable residential mortgage originations in 2024. We also recorded a $9.6 million loss in 2024 on the sale of a portion of our managed loan portfolio, which is reflected above in gain on sale of loans, net. The loss was offset by a similar dollar fair value gain, which was recorded in change in fair value of loans above.
Other noninterest income decreased by $405,000 in 2024 compared to 2023. The 2024 sale of mortgage servicing assets discussed above was made at fair value, so no initial gain or loss was recognized on the sale. However, terms of the sale required us to refund MSR premium on certain loans (delinquency, underwriting deficiencies, etc.). In 2024 we recognized a $1.7 million gain on debt extinguishment of $50.0 million in FHLB advances. We did not have any such debt extinguishment gain or loss in 2023. Offsetting this was the $1.1 million loss from MSR premium refund discussed above. Overall, we recognized $1.6 million in net losses on sale of other assets in 2024 compared with net gains of $292,000 in 2023. Other sources of noninterest income were relatively unchanged from 2023 to 2024.
Noninterest expense
The following table presents the major components of our noninterest expense for the years ended December 31, 2024 and 2023:
| (Dollars in thousands) Noninterest Expense |
For the years ended | $ Increase (Decrease) | ||||||||||||||||||
| 2024 | 2023 | |||||||||||||||||||
| Salaries and employee benefits | $ | 77,791 | $ | 104,286 | $ | (26,495) | ||||||||||||||
| Occupancy and equipment | 4,454 | 6,924 | (2,470) | |||||||||||||||||
| Data processing expense | 8,960 | 11,107 | (2,147) | |||||||||||||||||
| Professional fees | 4,139 | 4,879 | (740) | |||||||||||||||||
| Other taxes and insurance | 7,024 | 6,976 | 48 | |||||||||||||||||
| Other | 12,222 | 18,912 | (6,690) | |||||||||||||||||
| $ | 114,590 | $ | 153,084 | $ | (38,494) | |||||||||||||||
For 2024, noninterest expense declined by $38.5 million, or 25.1%, to $114.6 million, from $153.1 million in 2023. The largest driver of this decline was from a $26.5 million decline in salaries and employee benefits expense, driven primarily by lower variable commissions, along with other staff reductions, both consistent with lower residential mortgage origination volume and our ability to quickly and proactively manage our expense base. The table below identifies the primary components of salaries and benefits:
| (Dollars in thousands) Salaries and Employee Benefits |
For the years ended | $ Increase (Decrease) | ||||||||||||||||||
| 2024 | 2023 | |||||||||||||||||||
| Salaries and other compensation | $ | 42,443 | $ | 49,145 | $ | (6,702) | ||||||||||||||
| Salary deferral from loan origination | (4,001) | (8,174) | 4,173 | |||||||||||||||||
| Bonus and non-equity incentive compensation | 7,685 | 3,354 | 4,331 | |||||||||||||||||
| Mortgage production - variable compensation | 26,108 | 49,700 | (23,592) | |||||||||||||||||
| 401(k) matching contributions | 695 | 1,687 | (992) | |||||||||||||||||
| Medical insurance costs | 4,861 | 8,574 | (3,713) | |||||||||||||||||
| Total salaries and employee benefits | $ | 77,791 | $ | 104,286 | $ | (26,495) | ||||||||||||||
Of the $26.5 million decrease in salaries and employee benefits from 2023 to 2024, $23.6 million was from reductions in variable commission compensation associated with lower mortgage volume. Additionally, base salaries and other compensation decreased by $6.7 million in 2024 as we right-sized the Bank to align with lower loan production volume. Due
52
to our lower employee base, we also experienced reductions in our 401(k) matching contributions (down $992,000) and medical insurance costs (down $3.7 million). Partially offsetting these reductions were an increase in bonus and non-equity incentive compensation expense of $4.3 million and lower salary cost deferrals from lower production (down $4.2 million). Our average full time equivalent employees (FTE) for 2024 was 491 compared to 610 for 2023.
Occupancy and equipment expense decreased $2.5 million from 2023 to 2024 primarily due to lower building lease expense (down $1.4 million) as we downsized our facilities and personnel to align with lower production volume environment. Data processing fees also decreased in 2024 by $2.1 million from 2023 to 2024 consistent with lower overall production volume as much of our data processing costs are unit based, so these costs decrease with mortgage volume. Professional fees and other taxes and insurance expenses were relatively unchanged year over year, while other expenses decreased $6.7 million from 2023 to 2024. Other expenses include several categories of expenses which are typically more tied to mortgage volumes, including marketing and credit reporting fees and the loan repurchase reserve expense.
Income tax expense
Total income tax expense was $17.7 million for 2024, compared to $10.9 million for 2023. The effective tax rate was 24.31% for 2024 compared to 24.45% for 2023.
Operating Segment Analysis
We have two reporting segments, Retail Banking and MPP. As discussed in Note 22 of our Consolidated Financial Statements, our reportable segments have been determined based on management’s focus and internal reporting structure.
The MPP segment provides collateralized mortgage purchase facilities to independent mortgage bankers nationwide. The Retail Banking segment provides a vast array of financial products and services to consumers nationwide. These include residential mortgages, AIO Loans, other consumer loans, and loan servicing, as well as various types of deposit products, including checking, savings and time deposit accounts. It also includes general and administrative expenses for the enterprise-wide support functions, which are allocated among the segments, internal funds transfer pricing offsets resulting from allocations to or from the other segments, and certain elimination entries.
Our reported segments and the financial information disclosed in the reported segments are not necessarily comparable with similar information reported by other financial institutions. Furthermore, changes in management structure or allocation methodologies and procedures may result in future changes to previously reported operating segment financial information.
53
The following tables present our reported segment results for the years ended December 31, 2024 and 2023:
| (Dollars in thousands) | As of or for the Year Ended December 31, | ||||||||||||||||||||||||||||||||||
| 2024 | 2023 | ||||||||||||||||||||||||||||||||||
| Retail Banking |
MPP | Total | Retail Banking |
MPP | Total | ||||||||||||||||||||||||||||||
| Interest Income | $ | 204,087 | $ | 113,445 | $ | 317,532 | $ | 190,645 | $ | 76,737 | $ | 267,382 | |||||||||||||||||||||||
| Interest Expense | (203,317) | — | (203,317) | (166,163) | — | (166,163) | |||||||||||||||||||||||||||||
| Funds Transfer Pricing | 75,188 | (75,188) | — | 49,497 | (49,497) | — | |||||||||||||||||||||||||||||
| Net Interest Income | 75,958 | 38,257 | 114,215 | 73,979 | 27,240 | 101,219 | |||||||||||||||||||||||||||||
| Provision (benefit) for credit losses | (548) | 220 | (328) | (1,627) | 142 | (1,485) | |||||||||||||||||||||||||||||
| Net Income after provision | 76,506 | 38,037 | 114,543 | 75,606 | 27,098 | 102,704 | |||||||||||||||||||||||||||||
| Noninterest Income (1) | 67,505 | 5,418 | 72,923 | 91,483 | 3,584 | 95,067 | |||||||||||||||||||||||||||||
| Salaries and employee benefits | (72,348) | (5,443) | (77,791) | (99,838) | (4,449) | (104,287) | |||||||||||||||||||||||||||||
| Occupancy and equipment | (4,367) | (87) | (4,454) | (6,853) | (71) | (6,924) | |||||||||||||||||||||||||||||
| Other noninterest expense (2) | (31,796) | (549) | (32,345) | (41,446) | (427) | (41,873) | |||||||||||||||||||||||||||||
| Noninterest expense | (108,511) | (6,079) | (114,590) | (148,137) | (4,947) | (153,084) | |||||||||||||||||||||||||||||
| Expense Allocation (3) | 3,419 | (3,419) | — | 2,648 | (2,648) | — | |||||||||||||||||||||||||||||
| Net Income before Taxes | 38,919 | 33,957 | 72,876 | 21,600 | 23,087 | 44,687 | |||||||||||||||||||||||||||||
| Income Tax Expense | (9,679) | (8,038) | (17,717) | (5,281) | (5,644) | (10,925) | |||||||||||||||||||||||||||||
| Net Income before preferred dividends | $ | 29,240 | $ | 25,919 | $ | 55,159 | $ | 16,319 | $ | 17,443 | $ | 33,762 | |||||||||||||||||||||||
| Average Balance Sheet Assets | $ | 3,703,012 | $ | 1,418,411 | $ | 5,121,423 | $ | 3,725,065 | $ | 977,873 | $ | 4,702,938 | |||||||||||||||||||||||
| Period Ending Assets | $ | 3,513,191 | $ | 1,710,820 | $ | 5,224,011 | $ | 3,611,652 | $ | 1,146,826 | $ | 4,758,478 | |||||||||||||||||||||||
(1) Noninterest income for MPP only includes MPP related fees. All other noninterest income revenues are reflected in Retail Banking.
(2) Includes data processing, professional services, office supplies and other miscellaneous expenses.
(3) Reflects corporate overhead expense allocations used by both business segments; primarily consisting of corporate admin, finance, technology, human resources, risk, marketing and occupancy related allocations.
MPP
For 2024, our MPP segment reported net income before preferred dividends of $25.9 million, an increase of $8.5 million, or 48.6%, over the $17.4 million reported in 2023. The increase was driven primarily by a 45.1% increase in average balances reflecting strong new customer acquisition and market share gains.
Retail Banking
For 2024, our Retail Banking segment reported net income before preferred dividends of $29.2 million, an increase of $12.9 million, or 79.2%, over the $16.3 million reported in 2023. The increase was driven primarily by lower noninterest expense, which outpaced the decrease in noninterest income and net interest income. The decrease in noninterest expense reflects lower variable mortgage commissions and proactive expense management across the channel.
54
Discussion and Analysis of Financial Condition
The following table summarizes selected components of our balance sheets as of December 31, 2024 and 2023:
| December 31 | |||||||||||||||||
| (Dollars in thousands) | 2024 | 2023 | |||||||||||||||
| BALANCE SHEET DATA | |||||||||||||||||
| Total Assets | $ | 5,224,011 | $ | 4,758,479 | |||||||||||||
| Cash and cash equivalents | 376,295 | 351,890 | |||||||||||||||
| Equity and debt securities | 9,881 | 16,045 | |||||||||||||||
| Other securities | 69,574 | 67,487 | |||||||||||||||
| Loans and loans held for sale, net | 4,633,637 | 4,121,347 | |||||||||||||||
| Mortgage servicing rights | 15,133 | 95,339 | |||||||||||||||
| Deposits | 3,422,555 | 2,925,558 | |||||||||||||||
| Borrowings | 1,258,750 | 1,275,000 | |||||||||||||||
| Subordinated debentures | 43,933 | 39,368 | |||||||||||||||
| Total Equity Capital | 462,490 | 430,620 | |||||||||||||||
Total Assets
Total assets were $5.22 billion at December 31, 2024, a 9.8% increase from $4.76 billion at December 31, 2023. The $465.5 million increase in total assets from year end 2023 was primarily driven by higher net loans and loans held for sale, which increased by $512.3 million during 2024.
Loan Portfolio
The following table presents the balance and associated percentage of each major loan type within our portfolio, including net deferred fees and costs, as of the dates indicated:
| (Dollars in thousands) | December 31, 2024 | December 31, 2023 | |||||||||||||||||||||||||||||||||
| Amount | % of Total Gross Loans |
Amount | % of Total Gross Loans |
||||||||||||||||||||||||||||||||
| Residential: | |||||||||||||||||||||||||||||||||||
| Construction | $ | 51,408 | 1.1 | % | $ | 141,326 | 3.4 | % | |||||||||||||||||||||||||||
All-in-One (AIO)(1)
|
612,080 | 13.2 | % | 506,035 | 12.2 | % | |||||||||||||||||||||||||||||
Other Consumer / Home Equity(1)
|
97,258 | 2.1 | % | 106,650 | 2.6 | % | |||||||||||||||||||||||||||||
Residential Mortgage(2)
|
1,948,175 | 41.9 | % | 1,862,325 | 45.1 | % | |||||||||||||||||||||||||||||
| Commercial | 8,013 | 0.2 | % | 18,037 | 0.4 | % | |||||||||||||||||||||||||||||
| MPP | 1,710,820 | 36.8 | % | 1,146,826 | 27.7 | % | |||||||||||||||||||||||||||||
| Total Loans Held for Investment | 4,427,754 | 95.3 | % | 3,781,199 | 91.5 | % | |||||||||||||||||||||||||||||
| Loans Held for Sale | 217,073 | 4.7 | % | 352,443 | 8.5 | % | |||||||||||||||||||||||||||||
| Total Gross Loans (HFI and HFS) | $ | 4,644,827 | 100.0 | % | $ | 4,133,642 | 100.0 | % | |||||||||||||||||||||||||||
_____________________
(1)AIO and Other Consumer / Home Equity are aggregated into Home equity lines of credit loans within the tables in our consolidated financial statements.
(2)Residential Mortgage loans consist of Closed end first liens, Closed end second liens, and Land development loans.
Our loan portfolio includes both loans held for investment and loans held for sale. Our loans held for investment portfolio comprises over 95% of our total loans and provides higher yields than other categories of earnings assets. As evidence of our strong underwriting and diligent risk controls, our largest loan category, residential mortgages, has experienced very low net
55
charge-offs throughout our history, and our second largest loan category, MPP, has not experienced any charge-offs since we began this lending program in 2010.
Our MPP business offers facilities to independent mortgage banking companies located around the country. These are floating rate, short term loans that are collateralized by single-family mortgage loans that these mortgage banks are preparing to be delivered to the secondary mortgage market. In most cases, mortgage loans sit in the mortgage banking company’s facility for less than 30 days after the loan is funded.
Residential mortgage loans include fixed or adjustable-rate residential real estate loans collateralized by one-to-four family properties. Our portfolio is geographically diversified across the United States. To mitigate interest rate risk, most of the loans we choose to hold in our portfolio are floating rate loans. The majority of our residential mortgage loans at December 31, 2024 are first liens.
AIO loans are floating rate, first mortgage revolving equity loans that include a checking account linked to the revolving equity loan.
We also have a smaller portfolio of construction loans, home equity lines of credit, and commercial loans, which combined represented less than 4% of the overall loan portfolio as of December 31, 2024.
As of December 31, 2024, our total loans net of allowance for credit losses including loans held for sale was $4.63 billion compared to $4.12 billion on December 31, 2023. This loan growth was primarily attributable to the strong growth in MPP, which grew by 49.2% since December 31, 2023, reflecting the strength of scalable technology, long-standing strong relationships built by account executives since inception, as well as our ability to capitalize on recent market disruption within the business line. Another key driver of our overall loan growth is growth in our AIO loans, which grew by 21.0% to $612.1 million as of December 31, 2024, from $506.0 million at December 31, 2023. Prudently growing this portfolio and the associated loan customer relationships remains a key strategic priority for us.
As of December 31, 2024, residential mortgage comprised 41.9% of our total loan portfolio compared to 36.8% for MPP and 13.2% for AIO loans. As of December 31, 2023, residential mortgage comprised 45.1% of our total loan portfolio compared to 27.7% for MPP and 12.2% for AIO loans. The reduction in residential mortgages reflects normal amortization and pay-offs, as we are not strategically growing this portfolio.
Contractual Maturities and Rate Structures of Loan Portfolio
The following table sets forth the contractual maturities and rate structures at December 31, 2024 and 2023:
Contractual Loan Maturities as of December 31, 2024
| Due in 1 Year or less | Due after 1 Year through 5 years |
Due after 5 Years through 15 years |
Due after 15 years | Total | |||||||||||||||||||||||||||||||||||||||||||||||||
| (Dollars in thousands) | Fixed Rate |
Adjustable Rate |
Fixed Rate |
Adjustable Rate |
Fixed Rate |
Adjustable Rate |
Fixed Rate |
Adjustable Rate |
|||||||||||||||||||||||||||||||||||||||||||||
| Residential | |||||||||||||||||||||||||||||||||||||||||||||||||||||
| Construction | $ | 12,401 | $ | — | $ | — | $ | — | $ | — | $ | — | $ | 38,013 | $ | 994 | $ | 51,408 | |||||||||||||||||||||||||||||||||||
| All-in-One (AIO)(1) | — | — | — | — | — | — | — | 612,080 | 612,080 | ||||||||||||||||||||||||||||||||||||||||||||
| Other Consumer / Home Equity(1) | — | — | — | — | — | 70 | — | 97,188 | 97,258 | ||||||||||||||||||||||||||||||||||||||||||||
| Residential Mortgage(2) | 393 | 333 | 347 | 553 | 15,655 | 14,142 | 363,450 | 1,553,302 | 1,948,175 | ||||||||||||||||||||||||||||||||||||||||||||
| Commercial | — | 7,303 | 120 | 234 | 115 | 82 | 159 | — | 8,013 | ||||||||||||||||||||||||||||||||||||||||||||
| MPP | — | 1,710,820 | — | — | — | — | — | — | 1,710,820 | ||||||||||||||||||||||||||||||||||||||||||||
| Total Loans Held for Investment: | 12,794 | 1,718,456 | 467 | 787 | 15,770 | 14,294 | 401,622 | 2,263,564 | 4,427,754 | ||||||||||||||||||||||||||||||||||||||||||||
| Retail Loans Held for Sale: | — | — | — | — | — | — | 210,766 | 6,307 | 217,073 | ||||||||||||||||||||||||||||||||||||||||||||
| Total Gross Loans (HFI and HFS) | $ | 12,794 | $ | 1,718,456 | $ | 467 | $ | 787 | $ | 15,770 | $ | 14,294 | $ | 612,388 | $ | 2,269,871 | $ | 4,644,827 | |||||||||||||||||||||||||||||||||||
_____________________
(1)AIO and Other Consumer / Home Equity are aggregated into Home equity lines of credit loans within the tables in our consolidated financial statements.
(2)Residential Mortgage loans consist of Closed end first liens, Closed end second liens, and Land development loans.
56
Contractual Loan Maturities as of December 31, 2023
| Due in 1 Year or less | Due after 1 Year through 5 years |
Due after 5 Years through 15 years |
Due after 15 years | Total | |||||||||||||||||||||||||||||||||||||||||||||||||
| (Dollars in thousands) | Fixed Rate |
Adjustable Rate |
Fixed Rate |
Adjustable Rate |
Fixed Rate |
Adjustable Rate |
Fixed Rate |
Adjustable Rate |
|||||||||||||||||||||||||||||||||||||||||||||
| Residential | |||||||||||||||||||||||||||||||||||||||||||||||||||||
| Construction | $ | 25,986 | $ | — | $ | 4,148 | $ | — | $ | — | $ | — | $ | 110,113 | $ | 1,079 | $ | 141,326 | |||||||||||||||||||||||||||||||||||
| All-in-One (AIO)(1) | — | — | — | — | — | — | — | 506,035 | $ | 506,035 | |||||||||||||||||||||||||||||||||||||||||||
| Other Consumer / Home Equity(1) | — | 186 | — | — | — | 204 | — | 106,260 | 106,650 | ||||||||||||||||||||||||||||||||||||||||||||
| Residential Mortgage(2) | 515 | 53 | 337 | 843 | 12,447 | 13,879 | 276,889 | 1,557,362 | 1,862,325 | ||||||||||||||||||||||||||||||||||||||||||||
| Commercial | 89 | 16,738 | 331 | 262 | 175 | 278 | 164 | — | 18,037 | ||||||||||||||||||||||||||||||||||||||||||||
| MPP | — | 1,146,826 | — | — | — | — | — | — | 1,146,826 | ||||||||||||||||||||||||||||||||||||||||||||
| Total Loans Held for Investment: | 26,590 | 1,163,803 | 4,816 | 1,105 | 12,622 | 14,361 | 387,166 | 2,170,736 | 3,781,199 | ||||||||||||||||||||||||||||||||||||||||||||
| Retail Loans Held for Sale: | — | — | — | — | 2,694 | — | 332,135 | 17,614 | 352,443 | ||||||||||||||||||||||||||||||||||||||||||||
| Total Gross Loans (HFI and HFS) | $ | 26,590 | $ | 1,163,803 | $ | 4,816 | $ | 1,105 | $ | 15,316 | $ | 14,361 | $ | 719,301 | $ | 2,188,350 | $ | 4,133,642 | |||||||||||||||||||||||||||||||||||
_____________________
(1)AIO and Other Consumer / Home Equity are aggregated into Home equity lines of credit loans within the tables in our consolidated financial statements.
(2)Residential Mortgage loans consist of Closed end first liens, Closed end second liens, and Land development loans.
Our mortgage loan portfolio has ARMs which reset annually after the initial fixed rate period, which ranges from one to 10 years. AIO adjustable rate loans reset monthly. Expected maturities may differ from contractual maturities if borrowers have the right to call or prepay obligations with or without call or prepayment penalties.
As of December 31, 2024, 37.3% of our total loan portfolio had a contractual maturity of less than one year, up from 28.8% at December 31, 2023. The increase was primarily due to growth in our MPP business over this period. Our MPP facilities are floating rate and generally have terms of 30 days or less given that is the time period that a funded mortgage stays in our mortgage banking clients facility prior to the sale of the mortgage in the secondary market. Very few of our loans have intermediate contractual maturities of between one and fifteen years. As of December 31, 2024, 62.1% of total loans had contractual maturities of longer than 15 years, compared to 70.3% at December 31, 2023. For our two largest categories of long duration loans as of December 31, 2024, 80.5% of residential mortgage and 100% of our AIO Loans were floating rate.
57
Nonperforming Assets
The following table provides details of our nonperforming and restructured assets as of the dates presented and certain other related information:
| (Dollars in thousands) | December 31, 2024 | December 31, 2023 | |||||||||||||||
| Nonaccrual Loans(1): | |||||||||||||||||
| Commercial | 118 | — | |||||||||||||||
| Construction | 1,921 | 2,201 | |||||||||||||||
| Land Development | 2,312 | 2,201 | |||||||||||||||
| Home Equity Lines of Credit | 10,807 | 3,597 | |||||||||||||||
| First Lien Mortgage | 25,706 | 12,501 | |||||||||||||||
| First Lien Mortgage Wholly or Partially Guaranteed by the U.S Government | 32,159 | 12,525 | |||||||||||||||
| Junior Lien Mortgage | 1,532 | 726 | |||||||||||||||
| MPP | — | — | |||||||||||||||
| 74,555 | 33,751 | ||||||||||||||||
| Loans Past Due 90 Days or More and Still Accruing(1): | |||||||||||||||||
| Commercial | — | — | |||||||||||||||
| Construction | — | — | |||||||||||||||
| Land Development | — | — | |||||||||||||||
| Home Equity Lines of Credit | 200 | 497 | |||||||||||||||
| First Lien Mortgage | 3,823 | 2,785 | |||||||||||||||
| First Lien Mortgage Wholly or Partially Guaranteed by the U.S Government | 346 | 25,171 | |||||||||||||||
| Junior Lien Mortgage | 30 | — | |||||||||||||||
| MPP | — | — | |||||||||||||||
| 4,399 | 28,453 | ||||||||||||||||
| Total Nonperforming Loans | 78,954 | 62,204 | |||||||||||||||
| Other Real Estate Owned | 3,030 | 24 | |||||||||||||||
| Total Nonperforming Assets | $ | 81,984 | $ | 62,228 | |||||||||||||
| Nonaccrual Loans to Total Loans | 1.61 | % | 0.82 | % | |||||||||||||
| Nonperforming Loans to Total Loans | 1.70 | % | 1.50 | % | |||||||||||||
| Nonperforming Assets to Total Assets | 1.57 | % | 1.31 | % | |||||||||||||
| Allowance for Credit Losses to Nonaccrual Loans | 15.01 | % | 36.43 | % | |||||||||||||
| Ratios Excluding Loans Wholly or Partially Guaranteed by the U.S Government | |||||||||||||||||
| Nonaccrual Loans to Total Loans | 0.91 | % | 0.51 | % | |||||||||||||
| Nonperforming Loans to Total Loans | 1.00 | % | 0.60 | % | |||||||||||||
| Nonperforming Assets to Total Assets | 0.95 | % | 0.52 | % | |||||||||||||
| Allowance for Credit Losses to Nonaccrual Loans | 26.39 | % | 57.92 | % | |||||||||||||
_____________________
(1)Includes loans which are reported at fair value (see Note 18 of our consolidated financial statements).
At December 31, 2024, nonperforming assets were $82.0 million compared to $62.2 million at December 31, 2023. The increase in nonperforming assets was primarily driven by higher levels of loans that are wholly or partially guaranteed by the U.S. Government along with normal aging in the residential mortgage portfolio which contributed to higher nonperforming first liens and HELOCs. Nonperforming assets as a percent of total assets was 1.57% at December 31, 2024 compared to 1.31% at December 31, 2023.
58
Excluding the portion of our loans that are wholly or partially guaranteed by the U.S. Government, nonperforming assets to total assets increased to 0.95% at December 31, 2024, compared to 0.52% at December 31, 2023. At December 31, 2024, approximately 41% of our nonperforming loans have a form of government guarantee.
The Company uses a risk grading system for our loans to aid us in evaluating the overall credit of our loan portfolio and assessing the adequacy of our allowance for credit losses. All loans are categorized into a risk category at the time of origination. Loans are re-evaluated for proper risk grading as new information such as payment patterns, collateral condition and other relevant information comes to our attention.
The Company categorized each loan into credit risk categories based on current financial information, overall debt service coverage, comparison against industry averages, collateral coverage, historical payment experience, and current economic trends. The Company uses the following definitions for credit risk ratings:
A)Performing. Residential real estate credits not covered by the non-performing definition below.
B)Non-performing. Residential real estate loans classified as non-performing are generally loans on nonaccrual status.
C)Pass. Commercial credits not covered by the definitions below are pass credits, which are not considered to be adversely rated.
D)Special Mention (Watch). Loans classified as special mention, or watch credits, have a potential weakness or weaknesses that deserves management’s close attention. If left uncorrected, these potential weaknesses may result in deterioration of the repayment prospects for the loan or of the institution’s credit position at some future date.
E)Substandard. Loans classified as substandard are inadequately protected by the current net worth and paying capacity of the obligor or of the collateral pledged, if any. Loans so classified have a well-defined weakness or weaknesses that jeopardize the liquidation of the debt. They are characterized by the distinct possibility that the institution may sustain some loss if the deficiencies are not corrected.
F)Doubtful. These are loans in which the collection or liquidation of the entire debt is highly questionable or improbable. Typically, the possibility of loss is extremely high. The losses on these loans are deferred until all pending factors have been addressed.
Our classified assets are described in more detail in Note 3 of the Notes to Consolidated Financial Statements.
Allowance for Credit Losses and Net Charge-Offs
The allowance for credit losses is established through a provision for credit losses charged to operations. Loans are charged against the allowance for credit losses when management believes that the collectability of the principal is unlikely. Subsequent recoveries of previously charged off amounts, if any, are credited to the allowance for credit losses. The allowance for credit losses is evaluated on a regular basis by management and is based on management’s periodic review of the collectability of the loans considering historical experience, the nature and volume of the loan portfolio, adverse situations that may affect the borrower’s ability to repay, estimated value of any underlying collateral, and prevailing economic conditions. This evaluation is inherently subjective, as it requires estimates that are susceptible to significant revision as more information becomes available. While the entire allowance for credit losses is available to absorb losses from all loans, the following table represents management’s allocation of our allowance for credit losses by loan category, and the percentage of allowance for credit losses in each category, for the periods indicated:
59
| (Dollars in thousands) | December 31, 2024 | December 31, 2023 | |||||||||||||||||||||||||||||||||
| Dollars | % of Total |
Dollars | % of Total |
||||||||||||||||||||||||||||||||
| Collectively Allocated for Impairment: | |||||||||||||||||||||||||||||||||||
| Commercial | $ | 33 | 0.3 | % | $ | 52 | 0.4 | % | |||||||||||||||||||||||||||
| Construction | 390 | 3.5 | % | 488 | 4.0 | % | |||||||||||||||||||||||||||||
| Land Development | 976 | 8.7 | % | 1,607 | 13.1 | % | |||||||||||||||||||||||||||||
| Home Equity Lines of Credit | 1,920 | 17.2 | % | 2,039 | 16.6 | % | |||||||||||||||||||||||||||||
| First Lien Mortgage | 4,514 | 40.3 | % | 5,246 | 42.7 | % | |||||||||||||||||||||||||||||
| Junior Lien Mortgage | 1,672 | 14.9 | % | 2,211 | 18.0 | % | |||||||||||||||||||||||||||||
| MPP | 684 | 6.1 | % | 458 | 3.7 | % | |||||||||||||||||||||||||||||
| 10,189 | 91.1 | % | 12,101 | 98.4 | % | ||||||||||||||||||||||||||||||
| Individually Allocated for Impairment | 995 | 8.9 | % | 150 | 1.2 | % | |||||||||||||||||||||||||||||
| Unallocated | 6 | 0.1 | % | 44 | 0.4 | % | |||||||||||||||||||||||||||||
| 1,001 | 8.9 | % | 194 | 1.6 | % | ||||||||||||||||||||||||||||||
| Total Allowance for Credit Losses | $ | 11,190 | 100.0 | % | $ | 12,295 | 100.0 | % | |||||||||||||||||||||||||||
The following table provides an analysis of the activity in our allowance for the periods indicated:
| (Dollars in thousands) | For the Years Ended | ||||||||||||||||||||||||||||||||||
| December 31, 2024 | December 31, 2023 | ||||||||||||||||||||||||||||||||||
| Activity | % of Average Loans Held for Investment |
Activity | % of Average Loans Held for Investment |
||||||||||||||||||||||||||||||||
| Loans held for investment | $ | 4,427,754 | $ | 3,781,199 | |||||||||||||||||||||||||||||||
| Beginning allowance for credit losses | 12,295 | 6,365 | |||||||||||||||||||||||||||||||||
| Net (charge-offs) recoveries: | |||||||||||||||||||||||||||||||||||
| Commercial | 129 | 5.68 | % | 20 | 1.07 | % | |||||||||||||||||||||||||||||
| Construction | (532) | -0.53 | % | (482) | -0.23 | % | |||||||||||||||||||||||||||||
| Land Development | — | 0.00 | % | — | 0.00 | % | |||||||||||||||||||||||||||||
| Home Equity Lines of Credit | (1,208) | -0.27 | % | (183) | -0.04 | % | |||||||||||||||||||||||||||||
| First Lien Mortgage | (75) | 0.00 | % | (121) | -0.01 | % | |||||||||||||||||||||||||||||
| Junior Lien Mortgage | (300) | -0.47 | % | (42) | -0.05 | % | |||||||||||||||||||||||||||||
| MPP | — | 0.00 | % | — | 0.00 | % | |||||||||||||||||||||||||||||
| Total net (charge-offs) recoveries | (1,986) | (808) | |||||||||||||||||||||||||||||||||
| Provision for credit losses | 881 | (2,569) | |||||||||||||||||||||||||||||||||
| Impact of Adopting ASC 326 | — | 9,307 | |||||||||||||||||||||||||||||||||
| Ending allowance for credit losses | $ | 11,190 | $ | 12,295 | |||||||||||||||||||||||||||||||
| Allowance for credit losses to loans held for investment | 0.25 | % | 0.33 | % | |||||||||||||||||||||||||||||||
| Net charge-offs (recoveries) to Average Loans | 0.04 | % | 0.02 | % | |||||||||||||||||||||||||||||||
The allowance for credit losses was 0.25% of total loans as of December 31, 2024 compared to 0.33% as of December 31, 2023. Management estimates the allowance by using relevant available information from internal and external sources related to historical loss experience, current borrower risk characteristics, current economic conditions, reasonable and supportable forecasts, and other relevant factors. The allowance is measured on a collective or pool basis when similar risk characteristics exist or on an individual basis when loans have unique risk characteristics which differentiate them from other loans within the loan segment. The process for estimating credit losses incorporates methodologies and procedures specific to the residential and
60
commercial loan portfolios, each of which has unique risk characteristics. Our allowance for credit losses methodology is described in more detail in Note 2 of the Notes to Consolidated Financial Statements.
Our allowance for credit losses, and associated percentage of total loans, reflect the relative credit risk of our loan portfolio. These include the seasoning of the portfolio, LTV, FICO score, debt to income ratio (“DTI”) and collateral coverage. Given these risk characteristics, and the stark contrast to other financial institutions with a commercial heavy loan portfolio, our allowance and associated ratios will be much lower than those of bank peers with similar asset size. This nuance is also evidenced by the low level of charge-offs we have incurred. Additionally, as discussed above, our MPP portfolio makes up an increasing portion of our total loan portfolio and we have yet to experience any loss on that portfolio, so the allowance allocations are minimal for the residential mortgage portfolio. We also have purchased mortgage insurance on certain high loan to value loans, further minimizing our loss potential on those loans. Since 2019, our cumulative charge-offs, net of recoveries, totaled $3.1 million. Our annualized net charge-off rate was 0.04% for 2024 and 0.02% for 2023.
Mortgage Servicing Rights
Mortgage servicing rights are the contractual agreement to service existing mortgage loans held by other investors. Mortgage servicing rights were most typically created on mortgages that were originated by the Company but sold to third parties. Additionally, a small portion of our mortgage servicing rights were acquired from other mortgage originators. The mortgage servicing asset represents future cash flows the Company expects to receive from the mortgage for which it has the contractual right to service. Mortgage servicing rights totaled $15.1 million at December 31, 2024, a substantial decrease from $95.3 million at December 31, 2023. The decrease in 2024 was due to the Company’s strategic decision to sell the majority of its mortgage servicing rights portfolio. During 2024, we performed one bulk sale of mortgage servicing rights. The associated fair value of the assets and proceeds from the sale was $81.9 million.
Investment Portfolio
The Company has historically maintained a very small debt securities portfolio relative to other banking institutions preferring to invest in highly liquid loans or hold its liquidity in cash or cash equivalents. At December 31, 2024, debt securities totaled $8.6 million, or 0.16%, of total assets compared to $14.7 million, or 0.31% at December 31, 2023.
The following table presents the carrying value of our investment portfolio as of the dates indicated:
| (Dollars in thousands) | December 31, 2024 | December 31, 2023 | |||||||||||||||||||||||||||||||||
| Carrying Value |
% of Total |
Carrying Value |
% of Total |
||||||||||||||||||||||||||||||||
| Available for sale securities: | |||||||||||||||||||||||||||||||||||
| Corporate Debt | $ | 8,576 | 100.0 | % | $ | 14,727 | 100.0 | % | |||||||||||||||||||||||||||
| Total available for sale securities | 8,576 | 100.0 | % | 14,727 | 100.0 | % | |||||||||||||||||||||||||||||
| Total investment securities | $ | 8,576 | 100.0 | % | $ | 14,727 | 100.0 | % | |||||||||||||||||||||||||||
61
The following table presents the par value of our debt securities by their stated maturities, as well as the weighted average yields for each maturity range as of the dates indicated:
| December 31, 2024 | Due in 1 Year or Less | Due after 1 Year through 5 Years | Due after 5 Years through 10 Years | Due after 10 Years | Total | |||||||||||||||||||||||||||||||||||||||||||||||||||||||||
| Par Value |
Weighted
Avg
Yield(1)
|
Par Value |
Weighted
Avg
Yield(1)
|
Par Value |
Weighted
Avg
Yield(1)
|
Par Value |
Weighted
Avg
Yield(1)
|
Par Value |
Weighted
Avg
Yield(1)
|
|||||||||||||||||||||||||||||||||||||||||||||||||||||
| Available for sale securities: | ||||||||||||||||||||||||||||||||||||||||||||||||||||||||||||||
| Corporate Debt | — | — | — | — | $ | 9,000 | 6.63 | % | — | — | $ | 9,000 | 6.63 | % | ||||||||||||||||||||||||||||||||||||||||||||||||
| Total available for sale securities | — | — | — | — | 9,000 | 6.63 | % | — | — | 9,000 | 6.63 | % | ||||||||||||||||||||||||||||||||||||||||||||||||||
| Total investment securities | — | — | — | — | $ | 9,000 | 6.63 | % | — | — | $ | 9,000 | 6.63 | % | ||||||||||||||||||||||||||||||||||||||||||||||||
| December 31, 2023 | Due in 1 Year or Less | Due after 1 Year through 5 Years | Due after 5 Years through 10 Years | Due after 10 Years | Total | |||||||||||||||||||||||||||||||||||||||||||||||||||||||||
| Par Value |
Weighted
Avg
Yield(1)
|
Par Value |
Weighted
Avg
Yield(1)
|
Par Value |
Weighted
Avg
Yield(1)
|
Par Value |
Weighted
Avg
Yield(1)
|
Par Value |
Weighted
Avg
Yield(1)
|
|||||||||||||||||||||||||||||||||||||||||||||||||||||
| Available for sale securities: | ||||||||||||||||||||||||||||||||||||||||||||||||||||||||||||||
| Corporate Debt | — | — | $ | 5,000 | 6.00 | % | $ | 5,000 | 6.00 | % | $ | 5,500 | 5.40 | % | $ | 15,500 | 5.79 | % | ||||||||||||||||||||||||||||||||||||||||||||
| Total available for sale securities | — | — | 5,000 | 6.00 | % | 5,000 | 6.00 | % | 5,500 | 5.40 | % | 15,500 | 5.79 | % | ||||||||||||||||||||||||||||||||||||||||||||||||
| Total investment securities | — | — | $ | 5,000 | 6.00 | % | $ | 5,000 | 6.00 | % | $ | 5,500 | 5.40 | % | $ | 15,500 | 5.79 | % | ||||||||||||||||||||||||||||||||||||||||||||
______________________
(1)Weighted-average yields on investment securities are computed based on par value and exclude any premiums or discounts recorded. There are no tax-exempt securities in the portfolio.
Deposits
Deposits are the primary source of funding our business operations. As of December 31, 2024, total deposits were $3.42 billion compared to $2.93 billion at December 31, 2023. The $497.0 million, or 17.0%, increase in our deposits from year end 2023 reflects higher time deposits and demonstrates our ability to quickly scale up our deposit base to respond to market opportunities through interest bearing demand, brokered, rate board and retail CDs.
The following table summarizes our deposit composition by average deposits and average rates paid for the periods indicated:
| (Dollars in thousands) | December 31, 2024 | December 31, 2023 | |||||||||||||||||||||||||||||||||||||||||||||||||||
| Average Amount |
Weighted Avg Rate Paid |
Percent of Total Deposits | Average Amount |
Weighted Avg Rate Paid |
Percent of Total Deposits | ||||||||||||||||||||||||||||||||||||||||||||||||
| Noninterest bearing demand | $ | 250,135 | 0.00 | % | 8 | % | $ | 286,569 | 0.00 | % | 10 | % | |||||||||||||||||||||||||||||||||||||||||
| Interest bearing demand | 412,396 | 4.83 | % | 13 | % | 233,199 | 5.13 | % | 8 | % | |||||||||||||||||||||||||||||||||||||||||||
| Savings & money market | 380,131 | 4.39 | % | 12 | % | 434,395 | 3.62 | % | 14 | % | |||||||||||||||||||||||||||||||||||||||||||
| Time | 2,221,123 | 5.16 | % | 68 | % | 2,044,351 | 4.71 | % | 68 | % | |||||||||||||||||||||||||||||||||||||||||||
| Total deposits | $ | 3,263,785 | 4.63 | % | 100 | % | $ | 2,998,514 | 4.13 | % | 100 | % | |||||||||||||||||||||||||||||||||||||||||
62
The following tables set forth the maturity of time deposits for the periods indicated (dollars in thousands):
| December 31, 2024 | Three Months or Less |
Three to Six Months |
Six to Twelve Months |
After Twelve Months |
Total | |||||||||||||||||||||||||||
| Brokered CDs | $ | 1,731,707 | $ | — | $ | — | $ | 87,330 | $ | 1,819,037 | ||||||||||||||||||||||
| All other CDs | 69,327 | 60,775 | 151,851 | 87,979 | 369,932 | |||||||||||||||||||||||||||
| Total Time deposits | $ | 1,801,034 | $ | 60,775 | $ | 151,851 | $ | 175,309 | $ | 2,188,969 | ||||||||||||||||||||||
| December 31, 2023 | Three Months or Less |
Three to Six Months |
Six to Twelve Months |
After Twelve Months |
Total | |||||||||||||||||||||||||||
| Brokered CDs | $ | 1,381,776 | $ | — | $ | — | $ | 87,330 | $ | 1,469,106 | ||||||||||||||||||||||
| All other CDs | 84,987 | 17,964 | 71,341 | 60,477 | 234,769 | |||||||||||||||||||||||||||
| Total Time deposits | $ | 1,466,763 | $ | 17,964 | $ | 71,341 | $ | 147,807 | $ | 1,703,875 | ||||||||||||||||||||||
Total uninsured deposits were $309.9 million at December 31, 2024 and $269.7 million at December 31, 2023.
The following table shows the portion of time deposits that are uninsured, by remaining time until maturity, at December 31, 2024:
| (Dollars in thousands) | December 31, 2024 |
||||
| 3 months or less | $ | 1,150 | |||
| Over 3 through 6 months | 2,741 | ||||
| Over 6 through 12 months | 7,659 | ||||
| Over 12 months | 22,442 | ||||
| Total: | $ | 33,992 | |||
Borrowings
Another key source of funding for the Company are collateralized borrowings from the FHLB. At December 31, 2024, our total FHLB borrowings were $1.26 billion, up $16.3 million from $1.28 billion at December 31, 2023. At December 31, 2024, we had $1.10 billion in additional borrowing capacity at the FHLB. During the fourth quarter of 2024, we paid off a $50.0 million FHLB advance, recognizing a $1.7 million gain on debt extinguishment. We executed another early payoff of $102.5 million in FHLB advances in January 2025, recognizing a gain of $2.0 million. These extinguishments were funded through our receipt of new contractual interest bearing deposits with a similar duration.
The following table is a summary of our outstanding FHLB Advances for the periods indicated:
| (Dollars in thousands) | December 31, 2024 |
December 31, 2023 |
||||||||||||||||||
| Period ending balance | $ | 1,258,750 | $ | 1,275,000 | ||||||||||||||||
| Average balance during period | 1,300,488 | 1,150,342 | ||||||||||||||||||
| Maximum outstanding at any month end | 1,371,422 | 1,275,000 | ||||||||||||||||||
| Weighted average rate paid | 3.82 | % | 3.36 | % | ||||||||||||||||
Subordinated Debentures and Subordinated Debentures Issued through Trusts
At December 31, 2024, we had $40.0 million in outstanding subordinated debenture notes. These notes were issued to investors in two separate private placements, one in 2018 and one in 2024. The two outstanding subordinated notes totaling $40.0 million qualified as Tier 2 capital at our Bank entity.
At December 31, 2023, we had $35.0 million in outstanding subordinated debenture notes. These notes were issued to investors in two separate private placements, one in 2018 and one in 2019. The 2019 note placement for $20.0 million was called on September 30, 2024 and we replaced it with a $25.0 million note on August 22, 2024. The two outstanding subordinated notes totaling $35.0 million at December 31, 2023 qualified as Tier 2 capital at our Bank entity.
63
At December 31, 2024, and 2023 we had $5.0 million in subordinated debentures issued through trusts due on March 17, 2034, but callable on March 17, 2025, which qualified as Tier 1 capital at our Bank entity.
The following tables provide a summary of our outstanding subordinated notes and subordinated debentures issued through trusts for the periods indicated:
| Subordinated Notes and Subordinated Debentures issued through Trusts as of December 31, 2024 | |||||||||||||||||||||||||||||
| (Dollars in thousands) | Issuance Date | Amount of Notes |
Current Coupon | Next Call Date | Maturity Date | ||||||||||||||||||||||||
| Subordinated Notes: | |||||||||||||||||||||||||||||
| Fixed to Floating due 2028 (NPB) | September 28, 2018 | $ | 15,000 | 8.718% (3 mo SOFR + 4.03)% |
January 1, 2025 | October 1, 2028 | |||||||||||||||||||||||
| Fixed to Floating due 2034 (NPBI) | August 22, 2024 | 25,000 | 9.00% (fixed) | September 1, 2029 | September 1, 2034 | ||||||||||||||||||||||||
| Subordinated Debentures Issued Through Trusts: | |||||||||||||||||||||||||||||
| Trust Preferred due 2034 (NPBI) | March 17, 2004 | 5,000 | 7.74% (3 mo SOFR + 2.79)% |
March 17, 2025 | March 17, 2034 | ||||||||||||||||||||||||
| 45,000 | |||||||||||||||||||||||||||||
| Unamortized Issuance Costs | (1,103) | ||||||||||||||||||||||||||||
| $ | 43,897 | ||||||||||||||||||||||||||||
| Subordinated Notes and Subordinated Debentures issued through Trusts as of December 31, 2023 | |||||||||||||||||||||||||||||
| (Dollars in thousands) | Issuance Date | Amount of Notes |
Current Coupon | Next Call Date | Maturity Date | ||||||||||||||||||||||||
| Subordinated Notes: | |||||||||||||||||||||||||||||
| Fixed to Floating due 2028 (NPB) | September 28, 2018 | $ | 15,000 | 9.29% (3 mo SOFR + 4.03)% |
January 1, 2024 | October 1, 2028 | |||||||||||||||||||||||
| Fixed to Floating due 2029 (NPBI) | September 19, 2019 | 20,000 | 6.00% (fixed) | September 30, 2024 | September 30, 2029 | ||||||||||||||||||||||||
| Subordinated Debentures Issued Through Trusts: | |||||||||||||||||||||||||||||
| Trust Preferred due 2034 (NPBI) | March 17, 2004 | 5,000 | 8.38% (3 mo SOFR + 2.79)% |
March 15, 2024 | March 17, 2034 | ||||||||||||||||||||||||
| 40,000 | |||||||||||||||||||||||||||||
| Unamortized Issuance Costs | (632) | ||||||||||||||||||||||||||||
| $ | 39,368 | ||||||||||||||||||||||||||||
Impact of Inflation and Changing Prices
The Company’s financial statements included herein have been prepared in accordance with accounting principles generally accepted in the United States (GAAP). GAAP presently requires the Company to measure financial position and operating results primarily in terms of historic dollars. Changes in the relative value of money due to inflation or recession are generally not considered. The primary effect of inflation on the operations of the Company is reflected in increased operating costs, and the Company has experienced material effects of inflation during the last four fiscal years due to the government's monetary policies and the current economic climate. In management’s opinion, changes in interest rates affect the financial condition of a financial institution to a far greater degree than changes in the inflation rate. While interest rates are greatly influenced by changes in the inflation rate, they do not necessarily change at the same rate or in the same magnitude as the inflation rate. Interest rates are highly sensitive to many factors that are beyond the control of the Company, including changes in the expected rate of inflation, the influence of general and local economic conditions and the monetary and fiscal policies of the United States government, its agencies and various other governmental regulatory authorities, among other things, as further discussed in the next section.
64
Liquidity
Liquidity refers to our capacity to meet our cash obligations at a reasonable cost. Our cash obligations require us to have cash flow that is adequate to fund loan growth and maintain on-balance sheet liquidity while meeting present and future obligations of deposit withdrawals, borrowing maturities and other contractual cash obligations. In managing our cash flows, management regularly confronts situations that can give rise to increased liquidity risk. These include funding mismatches, market constraints in accessing sources of funds and the ability to convert assets into cash. Changes in economic conditions or exposure to credit, market, operational, legal and reputational risks also could affect our Bank’s liquidity risk profile and are considered in the assessment of liquidity management. The Company is a corporation separate and apart from our Bank and, therefore, must provide for its own liquidity, including liquidity required to meet its debt service requirements on its senior notes and junior subordinated debentures. The Company’s main source of cash flow is dividends declared and paid to it by the Bank.
There are statutory and regulatory limitations that affect the ability of our Bank to pay dividends to the Company. See the section entitled “Supervision and Regulation” and our forward looking statements elsewhere in this Form 10-K for more information. We believe that these limitations will not impact our ability to meet our ongoing short-term cash obligations. For contingency purposes, the Company typically maintains a minimum level of cash to fund two year’s projected operating cash flow needs and debt service. We continually monitor our liquidity position to ensure that our assets and liabilities are managed in a manner to meet all reasonably foreseeable short-term, long-term and strategic liquidity demands. Management has established a comprehensive management process for identifying, measuring, monitoring and controlling liquidity risk.
Because of its critical importance to the viability of our Bank, liquidity risk management is fully integrated into our risk management processes. Critical elements of our liquidity risk management include: effective corporate governance consisting of oversight by the board of directors and active involvement by management; appropriate strategies, policies, procedures and limits used to manage and mitigate liquidity risk; comprehensive liquidity risk measurement and monitoring systems including stress tests that are commensurate with the complexity of our business activities; active management of intraday liquidity and collateral; an appropriately diverse mix of existing and potential future funding sources; adequate levels of highly liquid marketable securities free of legal, regulatory, or operational impediments, that can be used to meet liquidity needs in stressful situations; comprehensive contingency funding plans that sufficiently address potential adverse liquidity events and emergency cash flow requirements; and internal controls and internal audit processes sufficient to determine the adequacy of our Bank’s liquidity risk management process.
The Company considers the maintenance of adequate liquidity to be an important part of managing risk. Consistent with our balance sheet strategy, we have intentionally kept our liquidity primarily in cash and interest-bearing deposits rather than investing heavily in investment securities, which typically includes significant unrealized gains or losses.
Our liquidity position is supported by management of our liquid assets and liabilities and access to alternative sources of funds. Our liquidity requirements are met primarily through our deposits, FHLB advances and the principal and interest payments we receive on loans and investment securities. Cash on hand, cash at third-party banks, and maturing or prepaying balances in our loan portfolios are our most liquid assets. Additionally, the Company has a unilateral right not to fund its MPP facilities, it could exercise within 30 days, if needed or as necessary, to generate additional liquidity. Other sources of liquidity that are routinely available to us include funds from retail and wholesale deposits, advances from the FHLB and proceeds from the sale of loans. See “FHLB Advances” above for more information regarding FHLB advances that are available to us. Less commonly used sources of funding include other borrowings and lines of credit. We believe we have ample liquidity resources to fund future growth and meet other cash needs as necessary.
Capital Adequacy
We and our Bank are subject to various regulatory capital requirements administered by the federal and state banking regulators. Our capital management consists of providing equity to support our current operations and future growth. Failure to meet minimum regulatory capital requirements may result in mandatory and possible additional discretionary actions by regulators that, if undertaken, could have a direct material effect on our consolidated financial statements. Under capital adequacy guidelines and the regulatory framework for prompt corrective action, our Bank must meet specific capital guidelines that involve quantitative measures of our assets, liabilities and off-balance sheet items as calculated under regulatory accounting policies. As of December 31, 2024, we and our Bank exceeded all applicable minimum regulatory capital requirements, including the capital conservation buffer applicable to our Bank, and our Bank qualified as “well-capitalized” for purposes of the FDIC’s prompt corrective action regulations.
65
The following table presents our regulatory capital ratios as of the dates presented, as well as the regulatory capital ratios that are required by FDIC regulations for our Bank to maintain “well-capitalized” status:
Regulatory Capital Ratios
| Actual | Required for Capital Adequacy Purposes |
Required to be Well Capitalized Under PCA |
|||||||||||||||||||||||||||||||||
| (Dollars in thousands) | Amount | Ratio | Amount | Ratio | Amount | Ratio | |||||||||||||||||||||||||||||
| Northpointe Bancshares Inc. | |||||||||||||||||||||||||||||||||||
| As of December 31, 2024 | |||||||||||||||||||||||||||||||||||
| Total capital to RWA | $509,591 | 12.09 | % | $337,246 | 8.00 | % | N/A | N/A | |||||||||||||||||||||||||||
| Tier 1 capital to RWA | $469,977 | 11.15 | % | $252,935 | 6.00 | % | N/A | N/A | |||||||||||||||||||||||||||
| Common Equity Tier 1 to RWA | $361,404 | 8.57 | % | $189,701 | 4.50 | % | N/A | N/A | |||||||||||||||||||||||||||
| Tier 1 capital to average assets (leverage) | $469,977 | 8.77 | % | $214,421 | 4.00 | % | N/A | N/A | |||||||||||||||||||||||||||
| As of December 31, 2023 | |||||||||||||||||||||||||||||||||||
| Total capital to RWA | $476,512 | 11.43 | % | $333,528 | 8.00 | % | N/A | N/A | |||||||||||||||||||||||||||
| Tier 1 capital to RWA | $438,611 | 10.52 | % | $250,147 | 6.00 | % | N/A | N/A | |||||||||||||||||||||||||||
| Common Equity Tier 1 to RWA | $317,454 | 7.61 | % | $187,611 | 4.50 | % | N/A | N/A | |||||||||||||||||||||||||||
| Tier 1 capital to average assets (leverage) | $438,611 | 9.19 | % | $190,958 | 4.00 | % | N/A | N/A | |||||||||||||||||||||||||||
| Northpointe Bank | |||||||||||||||||||||||||||||||||||
| As of December 31, 2024 | |||||||||||||||||||||||||||||||||||
| Total capital to RWA | $502,996 | 11.93 | % | $337,242 | 8.00 | % | $421,553 | 10.00 | % | ||||||||||||||||||||||||||
| Tier 1 capital to RWA | $487,519 | 11.56 | % | $252,932 | 6.00 | % | $337,242 | 8.00 | % | ||||||||||||||||||||||||||
| Common Equity Tier 1 to RWA | $487,519 | 11.56 | % | $189,699 | 4.50 | % | $274,010 | 6.50 | % | ||||||||||||||||||||||||||
| Tier 1 capital to average assets (leverage) | $487,519 | 9.09 | % | $214,419 | 4.00 | % | $268,024 | 5.00 | % | ||||||||||||||||||||||||||
| As of December 31, 2023 | |||||||||||||||||||||||||||||||||||
| Total capital to RWA | $469,422 | 11.26 | % | $333,528 | 8.00 | % | $416,909 | 10.00 | % | ||||||||||||||||||||||||||
| Tier 1 capital to RWA | $451,147 | 10.82 | % | $250,145 | 6.00 | % | $333,528 | 8.00 | % | ||||||||||||||||||||||||||
| Common Equity Tier 1 to RWA | $451,147 | 10.82 | % | $187,609 | 4.50 | % | $270,991 | 6.50 | % | ||||||||||||||||||||||||||
| Tier 1 capital to average assets (leverage) | $451,147 | 9.45 | % | $190,969 | 4.00 | % | $238,712 | 5.00 | % | ||||||||||||||||||||||||||
Off-balance Sheet Arrangements
In the normal course of business, we enter into lending commitments that are not on our consolidated balance sheet. The largest component is lending commitments to our MPP customers, which the Company has a unilateral right not to fund. The remainder are undrawn revolving loan commitments on our AIO Loans and undrawn commitments on home equity lines of credit. While these commitments represent contractual cash requirements, a portion of these commitments to extend credit are expected to expire without being drawn upon. Therefore, future commitments do not necessarily represent future cash requirements.
The following is a summary of our off-balance commitments outstanding as of the dates presented.
| (Dollars in thousands) | December 31, 2024 |
December 31, 2023 |
|||||||||||||||
| Commitments to fund loans held for investment | $ | 2,407,551 | $ | 3,373,318 | |||||||||||||
| Unused Commitments | 334,180 | 293,128 | |||||||||||||||
66
Item 7A. Quantitative and Qualitative Disclosures About Market Risk
Market risk represents the risk of loss due to changes in market values of assets and liabilities. We incur market risk in the normal course of business through exposures to market interest rates, equity prices, and credit spreads. We have identified interest rate risk as our primary source of market risk. Our primary business activities include gathering retail deposits, non-brokered rateboard time deposits, brokered CDs, and funding from the FHLB and other smaller facilities, which are used to invest in cash and loans. These activities involve interest rate risk, which arises from factors such as timing and volume differences in the repricing of our rate-sensitive assets and liabilities, changes in credit spreads, fluctuations in the general level of market interest rates, and shifts in the shape and level of market yield curves. Changes in interest rates can affect our current and prospective earnings, through volatility in our net interest income and the level of other interest rate-sensitive revenues and operating expenses. Interest rate fluctuations can also influence the underlying economic value of our assets, liabilities and off-balance sheet items. This is driven by the fact that the present values of future cash flows, and potentially the cash flows themselves, may change when interest rates materially move up or down depending on the economic environment.
Interest rate risk is generally considered a significant market risk for financial institutions. The Bank’s ALCO establishes broad policy limits with respect to interest rate risk. We have established a system for monitoring our net interest rate sensitivity positions. Our ALCO meets monthly to monitor the level of interest rate risk sensitivity to ensure compliance with the risk and policy limits. Effective management of interest rate risk begins with understanding the dynamic characteristics of assets and liabilities and determining the appropriate interest rate risk posture given business forecasts, management objectives, market expectations, and policy constraints. However, it is important to note that despite these measures, significant changes in interest rates could potentially impact our earnings, liquidity and capital positions.
An asset sensitive position refers to a balance sheet position in which an increase in short-term interest rates is expected to generate higher net interest income, as rates earned on our interest-earning assets would reprice upward more quickly than rates paid on our interest-bearing liabilities, thus expanding our net interest margin. Conversely, a liability sensitive position refers to a balance sheet position in which an increase in short-term interest rates is expected to generate lower net interest income, as rates paid on our interest- bearing liabilities would reprice upward more quickly than rates earned on our interest-earning assets, thus compressing our net interest margin.
We use interest rate risk models and rate shock simulations to assess the interest rate risk (“IRR”) sensitivity of net interest income and the economic value of equity (“EVE”) over a variety of parallel and non-parallel rate scenarios. A number of assumptions are used to calculate the impact of interest rate fluctuations on our net interest income, including asset prepayment speeds, non-maturity deposit price sensitivity, and decay rates. Due to the inherent use of estimates and assumptions in the model, our actual results may, and most likely will, differ from our simulated results. Any key model or input changes are reported to ALCO monthly. Management engages a third-party to review its IRR assumptions on an annual basis. Key findings are presented to ALCO.
Potential changes to our net interest income in hypothetical rising and declining rate scenarios are calculated as of December 31, 2024 and 2023 and are presented in the table below:
| (Shock in basis points) | Net Interest Income Sensitivity |
|||||||||||||||||||||||||
| 12 Month Projection | ||||||||||||||||||||||||||
| -200 | -100 | +100 | +200 | |||||||||||||||||||||||
| December 31, 2024 | -8.91 | % | -4.35 | % | 5.24 | % | 10.36 | % | ||||||||||||||||||
| December 31, 2023 | -2.49 | % | -1.89 | % | 1.87 | % | 3.23 | % | ||||||||||||||||||
We also model the impact of interest rate changes on our EVE. We base the modeling of EVE on interest rate shocks as shocks are considered more appropriate for EVE, which accelerates future interest rate risk into current capital via a present value calculation of all future cash flows from our Bank’s existing inventory of assets and liabilities. The results from our EVE modeling reflect only assets and liabilities that exist on our balance sheet in that period, and do not incorporate the large increases to noninterest income we generate when industry residential loan originations are significantly higher, such as in 2020 and 2021. The results of the model are presented in the table below:
| (Shock in basis points) | Economic Value of Equity Sensitivity | |||||||||||||||||||||||||
| -200 | -100 | +100 | +200 | |||||||||||||||||||||||
| December 31, 2024 | 2.13 | % | 2.53 | % | -1.88 | % | -4.30 | % | ||||||||||||||||||
| December 31, 2023 | 5.90% | 4.70% | -5.60% | -11.90% | ||||||||||||||||||||||
67
Item 8. Financial Statements and Supplementary Data
| Page | |||||
Report of Independent Registered Public Accounting Firm (PCAOB ID |
F-2 |
||||
F-3 |
|||||
F-4 |
|||||
F-5 |
|||||
F-6 |
|||||
F-7 |
|||||
F-8 |
|||||
F-1
Report of Independent Registered Public Accounting Firm
To the Shareholders and the Board of Directors of Northpointe Bancshares, Inc. and Subsidiary
Opinion on the Financial Statements
We have audited the accompanying consolidated balance sheets of Northpointe Bancshares, Inc. and Subsidiary (the Company) as of December 31, 2024 and 2023, the related consolidated statements of income, comprehensive income, changes in stockholders' equity and cash flows for the years then ended and the related notes to the consolidated financial statements (collectively, the financial statements). In our opinion, the financial statements present fairly, in all material respects, the financial position of the Company as of December 31, 2024 and 2023, and the results of its operations and its cash flows for the years then ended, in conformity with accounting principles generally accepted in the United States of America.
Basis for Opinion
These financial statements are the responsibility of the Company's management. Our responsibility is to express an opinion on the Company's financial statements based on our audits. We are a public accounting firm registered with the Public Company Accounting Oversight Board (United States) (PCAOB) and are required to be independent with respect to the Company in accordance with U.S. federal securities laws and the applicable rules and regulations of the Securities and Exchange Commission and the PCAOB.
We conducted our audits in accordance with the standards of the PCAOB. Those standards require that we plan and perform the audit to obtain reasonable assurance about whether the financial statements are free of material misstatement, whether due to error or fraud. The Company is not required to have, nor were we engaged to perform, an audit of its internal control over financial reporting. As part of our audits we are required to obtain an understanding of internal control over financial reporting but not for the purpose of expressing an opinion on the effectiveness of the Company's internal control over financial reporting. Accordingly, we express no such opinion.
Our audits included performing procedures to assess the risks of material misstatement of the financial statements, whether due to error or fraud, and performing procedures that respond to those risks. Such procedures included examining, on a test basis, evidence regarding the amounts and disclosures in the financial statements. Our audits also included evaluating the accounting principles used and significant estimates made by management, as well as evaluating the overall presentation of the financial statements. We believe that our audits provide a reasonable basis for our opinion.
/s/RSM US LLP
We have served as the Company's auditor since 2022.
March 28, 2025
F-2
Northpointe Bancshares, Inc.
Consolidated Balance Sheets
December 31, 2024 and 2023
(Dollars in thousands)
| 2024 | 2023 | ||||||||||
| Assets | |||||||||||
| Cash and cash equivalents | $ | $ | |||||||||
| Equity securities | |||||||||||
| Debt securities available for sale (Note 19) | |||||||||||
| Other securities | |||||||||||
| Loans held for sale, at fair value | |||||||||||
Total loans ($ |
|||||||||||
| Allowance for credit losses (Note 3) | ( |
( |
|||||||||
| Net loans | |||||||||||
| Mortgage servicing rights (Note 5) | |||||||||||
| Intangible assets, net | |||||||||||
| Premises and equipment (Note 4) | |||||||||||
| Other assets (Note 6) | |||||||||||
| Total Assets | $ |
|
$ |
|
|||||||
| Liabilities and Stockholders' Equity | |||||||||||
| Liabilities | |||||||||||
| Deposits: (Note 7) | |||||||||||
| Noninterest-bearing | $ | $ | |||||||||
| Interest-bearing | |||||||||||
| Total Deposits | |||||||||||
| Borrowings (Note 8) | |||||||||||
| Subordinated debentures (Note 11) | |||||||||||
| Subordinated debentures issues through trusts (Note 12) | |||||||||||
| Deferred tax liability | |||||||||||
| Other liabilities | |||||||||||
| Total Liabilities | |||||||||||
| Stockholders' Equity | |||||||||||
Preferred Stock Non-Cumulative - No Par Value; |
|||||||||||
Series A - |
|||||||||||
Series B - |
|||||||||||
Common Stock - No Par Value |
|||||||||||
Authorized - |
|||||||||||
| Additional paid in capital | |||||||||||
| Retained earnings | |||||||||||
| Accumulated other comprehensive loss | ( |
( |
|||||||||
| Total Stockholders' Equity | |||||||||||
| Total Liabilities and Stockholders' Equity | $ |
|
$ |
|
|||||||
See notes to consolidated financial statements.
F-3
Northpointe Bancshares, Inc.
Consolidated Statements of Income
Years Ended December 31, 2024 and 2023
(Dollars in thousands)
| 2024 | 2023 | ||||||||||
| Interest Income | |||||||||||
| Loans - Including fees | $ | $ | |||||||||
| Investment securities - Taxable | |||||||||||
| Other | |||||||||||
| Total interest income | |||||||||||
| Interest Expense | |||||||||||
| Deposits | |||||||||||
| Subordinated debentures | |||||||||||
| Borrowings | |||||||||||
| Total interest expense | |||||||||||
| Net Interest Income | |||||||||||
| Provision (Benefit) for Credit Losses | ( |
( |
|||||||||
| Net Interest Income after Provision (Benefit) for Credit Losses | |||||||||||
| Noninterest Income | |||||||||||
| Service charges on deposits and other fees | |||||||||||
| Loan servicing fees | |||||||||||
| MPP fees | |||||||||||
| Net gain on sale of loans | |||||||||||
| Other noninterest income | |||||||||||
| Total noninterest income | |||||||||||
| Noninterest Expense | |||||||||||
| Salaries and employee benefits | |||||||||||
| Occupancy and equipment | |||||||||||
| Data processing expense | |||||||||||
| Professional fees | |||||||||||
| Other taxes and insurance | |||||||||||
| Other noninterest expense | |||||||||||
| Total noninterest expense | |||||||||||
| Income - Before Income Taxes | |||||||||||
| Income Tax Expense | |||||||||||
| Net Income | |||||||||||
| Preferred Stock Dividends | |||||||||||
| Net Income available to common stockholders | $ |
|
$ |
|
|||||||
| Basic Earnings Per Common Share | $ |
|
$ |
|
|||||||
| Diluted Earnings Per Share | $ |
|
$ |
|
|||||||
See notes to consolidated financial statements.
F-4
Northpointe Bancshares, Inc.
Consolidated Statements of Comprehensive Income
Years Ended December 31, 2024 and 2023
(Dollars in thousands)
| 2024 | 2023 | ||||||||||
| Net Income | $ | $ | |||||||||
| Other Comprehensive Income (Loss) | |||||||||||
Change in unrealized loss on securities, net of tax of $ |
( |
||||||||||
Gain on sale of securities, net of tax of $ |
( |
||||||||||
| Total other comprehensive income (loss) | ( |
||||||||||
| Comprehensive Income | $ |
|
$ |
|
|||||||
See notes to consolidated financial statements.
F-5
Northpointe Bancshares, Inc.
Consolidated Statements of Changes in Stockholders’ Equity
Years Ended December 31, 2024 and 2023
(Dollars in thousands)
| Preferred Stock, Series A Shares |
Preferred Stock, Series B Shares |
Common Stock, Number of Shares |
Additional Paid-in Capital |
Retained Earnings |
Accumulated Other Comprehensive (Loss) Income |
Total | |||||||||||||||||||||||||||||||||||
| Balance - January 1, 2022 | $ |
|
$ |
|
$ | ( |
$ |
|
|||||||||||||||||||||||||||||||||
| Net Income | — | — | — | — | — | ||||||||||||||||||||||||||||||||||||
| — | — | — | — | ( |
— | ( |
|||||||||||||||||||||||||||||||||||
| Other comprehensive loss | — | — | — | — | — | ( |
( |
||||||||||||||||||||||||||||||||||
Dividends declared ($ |
— | — | — | — | ( |
— | ( |
||||||||||||||||||||||||||||||||||
| Treasury stock - repurchase | — | — | ( |
( |
— | — | ( |
||||||||||||||||||||||||||||||||||
| Preferred stock dividends | — | — | — | — | ( |
— | ( |
||||||||||||||||||||||||||||||||||
| Balance - December 31, 2023 | $ |
|
$ |
|
$ | ( |
$ |
|
|||||||||||||||||||||||||||||||||
| Net Income | — | — | — | — | — | ||||||||||||||||||||||||||||||||||||
| Other comprehensive income | — | — | — | — | — | ||||||||||||||||||||||||||||||||||||
Dividends declared ($ |
— | — | — | — | ( |
— | ( |
||||||||||||||||||||||||||||||||||
| Preferred stock - repurchase | ( |
— | — | ( |
— | ( |
|||||||||||||||||||||||||||||||||||
| Treasury stock - repurchase | — | — | ( |
( |
— | — | ( |
||||||||||||||||||||||||||||||||||
| Stock options exercised | — | — | — | — | |||||||||||||||||||||||||||||||||||||
| Preferred stock dividends | — | — | — | — | ( |
— | ( |
||||||||||||||||||||||||||||||||||
| Balance - December 31, 2024 | $ |
|
$ |
|
$ | ( |
$ |
|
|||||||||||||||||||||||||||||||||
See notes to consolidated financial statements.
F-6
Northpointe Bancshares, Inc.
Consolidated Statements of Cash Flows
Years Ended December 31, 2024 and 2023
(Dollars in thousands)
| 2024 | 2023 | ||||||||||
| Cash Flows from Operating Activities | |||||||||||
| Net Income | $ | $ | |||||||||
| Adjustments to reconcile consolidated net income to net cash and cash equivalents provided by (used in) operating activities: | |||||||||||
| Depreciation | |||||||||||
| Provision (benefit) for credit losses | ( |
( |
|||||||||
| Intangible asset impairment | |||||||||||
| Amortization of intangible asset | |||||||||||
| Amortization of bond premium | |||||||||||
| Amortization of debt issuance costs | |||||||||||
| Net gain on sale of loans | ( |
( |
|||||||||
| Proceeds from sales of loans held for sale | |||||||||||
| Origination of mortgage loans held for sale | ( |
( |
|||||||||
| Net loss (gain) on sales of other real estate | ( |
||||||||||
| Net loss on disposal of premises and equipment | |||||||||||
| Net gain on extinguishment of debt | ( |
||||||||||
| Net loss on sale of mortgage servicing rights | |||||||||||
| Net gain on sale of available for sale debt securities | ( |
||||||||||
| MSR change in fair value | |||||||||||
| Deferred tax expense | ( |
( |
|||||||||
| Change in fair value of equity securities | ( |
||||||||||
| Change in mortgage banking derivatives | ( |
||||||||||
| Net change in: | |||||||||||
| Other assets | ( |
||||||||||
| Accrued and other liabilities | ( |
( |
|||||||||
| Net cash and cash equivalents provided by operating activities | |||||||||||
| Cash Flows from Investing Activities | |||||||||||
| Purchase of FHLB stock | ( |
( |
|||||||||
| Redemption of FHLB stock | |||||||||||
| Proceeds from sale of available for sale debt securities | |||||||||||
| Purchase of available for sale debt securities | ( |
||||||||||
| Purchase of mortgage servicing rights | ( |
||||||||||
| Proceeds from sale of mortgage servicing rights | |||||||||||
| Proceeds from sales of other real estate | |||||||||||
| Purchases of premises and equipment | ( |
( |
|||||||||
| Net increase in loans | ( |
( |
|||||||||
| Contributions from Lender Risk Account | ( |
( |
|||||||||
| Proceeds from Lender Risk Account | |||||||||||
| Net cash and cash equivalents used in investing activities | ( |
( |
|||||||||
| Cash Flows from Financing Activities | |||||||||||
| Net change in deposits | |||||||||||
| Cash dividends paid on common stock | ( |
( |
|||||||||
| Subordinated debt call and repayment | ( |
( |
|||||||||
| Subordinated debt issuance, net of costs | |||||||||||
| Advances of FHLB borrowings | |||||||||||
| Repayment of FHLB borrowings | ( |
||||||||||
| Preferred stock dividend | ( |
( |
|||||||||
| Preferred stock repurchase | ( |
||||||||||
| Stock repurchased | ( |
( |
|||||||||
| Proceeds from exercised stock options | |||||||||||
| Net cash and cash equivalents provided by financing activities | |||||||||||
| Net Increase in Cash and Cash Equivalents | |||||||||||
| Cash and Cash Equivalents - Beginning of year | |||||||||||
| Cash and Cash Equivalents - End of year | $ |
|
$ |
|
|||||||
See notes to consolidated financial statements.
Consolidated Statements of Cash Flows (Continued)
Years Ended December 31, 2024 and 2023
(Dollars in thousands)
| Supplemental Cash Flow Information | 2024 | 2023 | |||||||||
| Cash paid for: | |||||||||||
| Interest | $ | $ | |||||||||
| Income taxes | |||||||||||
| Non-cash supplemental information: | |||||||||||
| Rebooked GNMA loans over 90 days | ( |
||||||||||
| Loans transferred to other real estate | |||||||||||
| Loans transferred from loans held for sale to loans | |||||||||||
| Loans transferred from loans to loans held for sale | |||||||||||
| Adoption of ASC 326 | |||||||||||
F-7
Northpointe Bancshares, Inc.
Notes to Consolidated Financial Statements
Note 1 — Nature of Operations
Northpointe Bancshares, Inc.’s (the “Company”) primary lending focus is the origination of residential mortgages throughout the United States. The majority of these loans are sold in the secondary market through a network of investors. The Company has also developed a mortgage advance program which provides funding to pre-approved mortgage bankers who originate and sell individual conforming and non-qualified loan products in the secondary market. The Company continues to service loans which were originated and sold to investors as well as loans held in its portfolio which were originated and selectively held in portfolio.
Note 2 — Significant Accounting Policies
Basis of Presentation and Consolidation
The consolidated financial statements include the accounts of Northpointe Bancshares, Inc. and its wholly owned subsidiary, Northpointe Bank (the “Bank”). All significant intercompany balances and transactions have been eliminated in consolidation.
Significant Group Concentrations of Credit Risk
The Company’s only banking branch is located in Michigan, but the Company markets its banking products to deposit customers located throughout the United States. The Company is also active nationwide in mortgage lending through a network of mortgage bankers and other financial institutions. Note 3 discusses the types of lending in which the Company engages. The Company’s primary concentration is in real estate lending, including the origination and sale of 1 – 4 family real estate mortgages to the secondary market to Government Sponsored Entities (“GSEs”).
Change in Presentation due to Stock Split
On December 19, 2024, the stockholders approved a 10 -for-1 stock split whereby each holder of common stock received nine additional shares of common stock for each share owned as of the record date of December 19, 2024. Such shares were distributed on December 30, 2024. All share and per share amounts set forth in the consolidated financial statements of the Company have been retroactively restated to reflect the stock split as if it had occurred as of the earliest period presented.
Reclassifications
Some items in the prior year consolidated financial statements were reclassified to conform to the current presentation. These reclassifications had no impact on prior year net income or stockholders’ equity.
Revenue Recognition
Net gain on sale of loans held for sale includes all components related to the origination and sale of mortgage loans, including (1) net gain on sale of loans, which represents the premium received in excess of the loan principal amount and certain fees charged by investors upon sale of loans into the secondary market, (2) loan origination fees (credits), points and certain costs, (3) provision for or benefit from investor reserves, (4) the change in fair value of interest rate locks, loans held for sale, and held for investment, (5) the gain or loss on forward commitments hedging loans held for sale and interest rate lock commitments (“IRLCs”), (6) the fair value of Lender Risk Account (“LRA”), and (7) capitalization of MSRs. An estimate of the net gain on sale of loans is recognized at the time an IRLC is issued, net of a pull-through factor (percentage of locked volume that end up closing). Subsequent changes in the fair value of IRLCs and mortgage loans held for sale are recognized in current period earnings. When the mortgage loan is sold into the secondary market, any difference between the proceeds received and the current fair value of the loan is recognized in current period earnings in net gain on sale of loans held for sale.
Loan servicing fees include income from (1) servicing, (2) sub-servicing and ancillary fees, and is recorded to income as earned, which is upon collection of payments from borrowers, and (3) the fair value changes in MSRs.
F-8
Net interest income includes interest earned on held for investment loans (including Mortgage Purchase Program “MPP”), held for sale loans, and securities, net of the interest expense paid on our deposit and borrowing facilities. Interest income is recorded as earned and interest expense is recorded as incurred.
ASC 606, Revenue Recognition (“Topic 606”), (i) creates a single framework for recognizing revenue from contracts with customers that fall within its scope and (ii) revises when it is appropriate to recognize a gain (loss) from the transfer of nonfinancial assets, such as other real estate owned. The majority of the Company’s revenue is from interest income, including loans and securities, which are outside the scope of the standard. The services that fall within the scope of the standard are presented within noninterest income on the consolidated statement of income and are recognized as revenue as the Company satisfies its obligations to the customer. The revenue that falls within the scope of Topic 606 is primarily related to service charges on deposit accounts, debit/credit card and ATM fees, and sales of other real estate owned, when applicable.
Cash and Cash Equivalents
For the purpose of the consolidated statements of cash flows, cash and cash equivalents include cash on hand, cash items in process of collection, balances due from other financial institutions and federal funds sold which mature within 90 days. The Company maintains its cash in deposits accounts, the balance of which, at times may exceed federally insured limits. The Company has not experienced any losses in such accounts. Management believes that the Company is not exposed to any significant credit risk on cash and cash equivalents.
Securities
Debt securities are classified as available for sale or held to maturity. Securities classified as available for sale are recorded at fair value with unrealized gains and losses excluded from earnings and reported in other comprehensive (loss) income. Securities classified as held to maturity are to be carried at cost only if the Company has the positive intent and ability to hold these securities to maturity. Equity securities include investments in mutual funds and are recorded at fair value with unrealized gains and losses included in noninterest income in the accompanying consolidated statements of income. Purchase premiums and discounts on debt securities are recognized in interest income using the interest method. Gains and losses on the sale of securities are recorded on the trade date and are determined using the specific identification method.
Other securities, totaling $69.6 million and $67.5 million at December 31, 2024 and 2023, respectively, consist of restricted Federal Home Loan Bank stock, which is carried at cost and periodically evaluated for credit losses. Both cash and stock dividends are reported as other interest income.
Loans Held for Sale
Loans originated and intended for sale in the secondary market are carried at fair value in accordance with the fair value option. Net unrealized gains and losses are recognized in net gain on sale of loans in the accompanying consolidated statements of income. Fair value is determined on an aggregate basis based on commitments from investors to purchase such loans and upon prevailing market rates. See Note 18 for a description of the methods used to determine fair value at December 31, 2024 and 2023.
F-9
Originated government guaranteed loans are pooled and sold as Ginnie Mae MBS. Pursuant to Ginnie Mae servicing guidelines, the Company has the unilateral right to repurchase loans securitized in Ginnie Mae pools that are due, but unpaid, for three consecutive months (typically referred to as 90 days past due). As a result, once the delinquency criteria have been met, regardless of whether the repurchase option has been or intends to be exercised, the loan is required to be re-recognized on the balance sheet by the Company. These loans, totaling $0 as of December 31, 2024 and totaling $22.8 million as of December 31, 2023, are recorded in loans held for sale and a corresponding liability to repurchase the loans is recorded in other liabilities on the consolidated balance sheets.
Mortgage Purchase Program (“MPP”)
The Company has developed a program whereby it provides a collateralized mortgage purchase facility marketed to independent mortgage bankers nationwide. The Company refers to this as its Mortgage Purchase Program (“MPP”). Individual advances under the facility are reviewed and approved by the Company and are secured by specific one-to-four family mortgage loans. These facilities enable the Company’s MPP clients to close and fund their mortgages and during a relatively short period (typically less than 30 days), the originated loans are sold into the secondary market via government agencies (Fannie Mae, Freddie Mac or Ginnie Mae) or institutional investors (banks, large mortgage companies, insurance companies, mortgage REIT’s) or are securitized.
The Company, from time to time, also participates out portions of the individual advances (“the participating interest”) through participation agreements with other financial institutions. Cash flows associated with the individual advances are shared on a pro-rata basis with the participating banks.
The Company charges the mortgage banker an administrative fee per individual mortgage loan and earns interest while the loan is owned by the Company. Fee income is included in MPP fees on the Consolidated Statements of Income. There were no delinquent loans and or credit losses in the Company’s MPP business during 2024 or 2023.
Extended dwell sub-limits of purchase facilities, which have longer than expected standard turn times to be sold, may be issued to the mortgage bankers to facilitate loans that may not be delivered to the secondary market within the terms of the original advance. At December 31, 2024 and 2023, the Bank had outstanding balances on these facilities of $31.4 million and $28.3 million, respectively.
Participations of the individual advances referenced above are accounted for as sales, when control over the assets has been surrendered. Control over transferred assets is deemed to be surrendered when (1) the assets have been isolated from the Company, (2) the transferee obtains the right (free of conditions that constrain it from taking advantage of the right) to pledge or exchange the transferred assets, and (3) the Company does not maintain effective control over the transferred assets through an agreement to repurchase them before their maturity.
Mortgage Servicing Rights
Servicing assets are recognized as separate assets when rights are acquired through purchase or through sale of financial assets with servicing retained. The Company has adopted the fair value method of accounting for capitalized mortgage loan servicing rights pursuant to FASB Accounting Standards Codification topic 860 — “Transfers and Servicing”.
Mortgage Banking Derivatives and Financial Instruments
The Company enters into various derivative contracts and holds financial instruments to manage risk associated with the loans originated with the intention to sell on the secondary market. The Company has not designated any of the derivatives as hedging instruments. All derivatives are recorded at fair value with the change in fair value impacting net gain on sale of loans. Derivatives include commitments to originate loans and forward sales commitments; commitment to originate loans intended to be sold whereby the interest rate on the loan is determined prior to funding “interest rate lock commitment”; forward sales commitments whereby the Company has a mandatory commitment to deliver loans at a future date. The fair value of both rate lock commitments and mandatory forward sales commitments is based on the estimated cash flows associated with delivering a pool of assets at the prevailing market rates and pull through rate. See Note 18 for more detail on fair value of these commitments at December 31, 2024 and 2023.
F-10
Lender Risk Account
A Lender Risk Account (“LRA”) has been established for loans sold by the Company to the Federal Home Loan Bank of Indianapolis (“FHLB”). The LRA is funded through a reduction of the purchase price and maintained by the FHLB at 1.20 % of the loan balance and is used to offset credit losses over the life of the loans sold by the Company to the FHLB. If the LRA has not been depleted by losses, funds are returned to the Company over time, beginning after five years and continuing through 25 years. As of December 31, 2024 and 2023, the Company had on deposit with the FHLB $54.7 million and $56.0 million, respectively, in these LRA’s. Additionally, as of December 31, 2024 and 2023, the Company estimated the guaranty account, which is recorded in other liabilities in the Company’s Consolidated Balance Sheets, to be $3.9 million and $2.3 million, respectively. The Company carries the LRA asset at fair value in the Company’s Consolidated Balance Sheets in other assets with changes in the fair value included in the consolidated statements of income with net gain on sale of loans. The fair value of the LRA was $28.4 million and $31.7 million at December 31, 2024 and 2023, respectively. See Note 18 for a description of the methods and assumptions used to determine fair value at December 31, 2024 and 2023.
Loans
The Company offers a mortgage purchase program (“MPP”) and residential mortgage loans to its clients and customers. Those include the All-in-One, or “AIO” loan, which is a specialized first mortgage revolving equity line of credit linked by one account to a demand deposit bank account of the borrower. The ability of the Company’s debtors to honor their contracts is dependent upon the real estate and general economic conditions in the markets where the Company has originated loans.
Loans that management has the intent and ability to hold for the foreseeable future or until maturity or pay-off and where the fair value option has not been elected are reported at their outstanding unpaid principal balances adjusted for charge-offs, the allowance for credit losses, and any deferred fees or costs on originated loans. Interest income is accrued on the unpaid principal balance. Loan origination fees, net of certain direct origination costs, are deferred and recognized as an adjustment of the related loan yield using the interest method.
Accrued interest receivable for loans is included in other assets on the Company’s consolidated balance sheet. The Company elected not to measure an allowance for accrued interest receivable and instead elected to reverse accrued interest income on loans that are placed on nonaccrual status. Accrued interest on loans totaled $20.8 million and $20.9 million as of December 31, 2024 and 2023 and is included in other assets in the Consolidated Balance Sheets.
The accrual of interest on loans is discontinued at the time the loan is delinquent (120 days for mortgages and 90 days for commercial) unless the credit is well secured and in process of collection. In all cases, loans are placed on nonaccrual or charged off at an earlier date if collection of principal or interest is considered doubtful.
All interest accrued but not collected for loans that are placed on nonaccrual or charged off is reversed against interest income. The interest on these loans is accounted for on the cash basis or cost-recovery method, until qualifying for return to accrual. Loans are returned to accrual status when all the principal and interest amounts contractually due are brought current and future payments are reasonably assured.
Allowance for Credit Losses (“Allowance”)
Management estimates the allowance by using relevant available information from internal and external sources related to historical loss experience, current borrower risk characteristics, current economic conditions, reasonable and supportable forecasts, and other relevant factors. The allowance is measured on a collective or pool basis when similar risk characteristics exist or on an individual basis when loans have unique risk characteristics which differentiate them from other loans within the loan segment. The process for estimating credit losses incorporates methodologies and procedures specific to the residential and commercial loan portfolios, each of which has unique risk characteristics. Each of these portfolios is further disaggregated into loan segments, which are discussed in more detail below.
F-11
A loss given default methodology is utilized to estimate losses on the residential loan portfolio, which makes up substantially all held-for-investment loans. This methodology is used to project a default rate, prepayment rate, and severity factor for each loan in the portfolio to arrive at the lifetime credit loss for the construction and land development, home equity loans, and closed end, first and second liens. The accumulated expected credit losses are impacted by changes in borrower delinquencies, changes in loan to values, and changes in FICO scores. Lifetime credit losses are also adjusted by reasonable and supportable economic forecasts. As of December 31, 2024 and 2023, the Moody’s Baseline December U.S. Macroeconomic Outlook was utilized.
For the majority of the commercial loan portfolio, a discounted cash flow methodology adjusted for peer group benchmarks on probability of default, prepayment speeds, and curtailment rate is used. For MPP, as the Company has not experienced any losses, the accumulated expected credit losses are currently derived based on qualitative factors described below. Within these portfolios, management utilizes an internal loan grading system and assigns each loan a grade of pass, special mention, substandard, or doubtful, which are more fully explained in Note 3. The amount of credit losses, if any, is measured by a comparison of the loan’s carrying value to the net present value of future cash flows using the loan’s existing rate or at the fair value of collateral if repayment is expected to solely from the collateral.
Loans that do not share risk characteristics are evaluated on an individual basis and are not included in the collective evaluation. Factors considered by management in determining credit losses include payment status, collateral value, and the probability of collecting scheduled principal and interest payments when due. Loans that experience insignificant payment delays and payment shortfalls generally are not classified as individually evaluated. Management determines the significance of payment delays and payment shortfalls on a case-by-case basis, taking into consideration all of the circumstances surrounding the loan and the borrower, including length of the delay, the reasons for the delay, the borrower’s prior payment record, and the amount of the shortfall in relation to the principal and interest owed. Credit losses are individually analyzed by either the present value of expected future cash flows discounted at the loan’s effective interest rate, the loan’s obtainable market price, or the fair value of the collateral if the loan is collateral dependent.
Qualitative Factors
Each quarter, management also considers the need to adjust historical loss rates as determined to reflect the extent to which current conditions and reasonable and supportable economic forecasts are expected to differ or where specific risks and uncertainties are not fully captured by the quantitative model. These qualitative adjustments may increase or decrease the estimate of expected future credit losses. The qualitative factors include economic forecast uncertainty, underwriting and collection trends, changes in nature and volume of portfolio, changes in the volume and severity of past due loans, collateral trends, concentration risk, quality of loan review, changes in personnel, external factors, and other considerations.
Residential Loan Segments
Construction and land development: Construction and land development loans consist of loans to individuals for the construction of their primary residences. Loans to individuals for the construction of their residences typically run for up to 12 or 18 months and then convert to permanent loans. These construction loans have rates and terms comparable to one-to-four family loans. During the construction phase, the borrower pays interest only. The maximum loan-to-value ratio of owner-occupied single-family construction loans is 80%. Residential construction loans are generally underwritten pursuant to the same guidelines used for originating permanent residential loans.
Construction loans generally are made for relatively short terms. However, to the extent construction loans are not made to owner-occupants of single-family homes, they are more vulnerable to changes in economic conditions and the concentration of credit with a limited number of borrowers. Further, the nature of these loans is such that they are more difficult to evaluate and monitor. The risk of loss on a construction loan is dependent largely upon the accuracy of the initial estimate of the property’s value upon timely completion of the project and the estimated cost (including interest) of the project.
Home equity lines of credit: Home equity lines of credit mainly consist of variable-rate home equity lines of credit secured by a lien on the borrower’s primary residence. Home equity products are limited to 90% of the property value less any other mortgages if the first loan is with the Bank. Home equity products in a secondary lien position are limited to 85% of the property value less any superior liens. The Company uses the same underwriting standards for home equity lines of credit as it uses for one-to-four family residential mortgage loans. Home equity lines of credit provide for an initial draw period of up to ten years. Home equity loans are susceptible to weakening general economic conditions and increase in unemployment rates and declining real estate values.
F-12
Closed end, first and second liens: Closed end, first and second liens consist of one-to-four family residential loans which are primarily loans secured by first or second liens or mortgages on primary residences. The Company originates adjustable-rate and fixed-rate, one-to-four-family residential real estate loans for the construction, purchase or refinancing of a mortgage. These loans are collateralized by owner-occupied properties. Loans on one-to-four-family residential real estate are generally originated in amounts of up to 90% for owner-occupied one-to-four family homes and up to 85% for non-owner occupied homes. Mortgage title insurance and hazard insurance are normally required. Such loans are susceptible to weakening general economic conditions and increases in unemployment rates and declining real estate values.
Commercial Loan Segments
Commercial: Commercial business loans and lines of credit consist of loans to small- and medium- sized companies in the Company’s market area. Commercial business loans are generally used for working capital purposes. Risk to this category include declining valuation of collateral and weakening general economic conditions.
MPP: The Company has developed a program whereby it provides lending facilities to pre-approved mortgage bankers. Individual advances under the facility are reviewed and approved by the Company and are secured by specific one-to-four family mortgage loans, which the mortgage banker intends to sell and deliver to the secondary market within 60 days. The MPP business is susceptible to weakening general economic conditions and increases in unemployment rates and declining real estate values.
Unfunded Loan Commitments
The Company is also required to consider expected credit losses associated with loan commitments over the contractual period in which it is exposed to credit risk on the underlying commitments unless the obligation is unconditionally cancellable by the Company. Any allowance for off balance sheet credit exposure is reported in other liabilities on the Company’s consolidated balance sheets and is increased or decreased by provision for credit losses on the Company’s consolidated statement of income. The calculation uses the same methodology, inputs, and assumptions as the funded portion of the loans at the segment level applied to the amount of commitments expected to be funded.
Off-balance-sheet Instruments
Other Real Estate Owned
Bank Premises and Equipment, net
Premises and equipment are carried at cost, less accumulated depreciation and amortization. Depreciation, computed on the straight-line method, is charged to occupancy and equipment expense in the Consolidated Statements of Income over the estimated useful lives of the assets ranging from 1 to 40 years. Leasehold improvements are amortized over the terms of their respective leases or the estimated useful lives of the improvements, whichever is shorter. Interest costs incurred during the construction period of new facilities are capitalized as part of the cost of the building and depreciated over the estimated useful life of the asset.
F-13
Leases
ASU 2016-02, Leases establishes a right-of-use (ROU) model that requires a lessee to record a ROU asset and a lease liability on the balance sheet for all leases with terms longer than 12 months. Leases are classified as either finance or operating, with classification affecting the pattern of expense recognition in the income statement. Right of use assets and lease liabilities are recognized at lease commencement date based upon the estimated present value of lease payments over the lease term.
The right of use assets and lease liabilities were $1.5 million and $1.5 million, respectively, at December 31, 2024 and were $2.6 million and $2.5 million at December 31, 2023. Right of use assets are included in and lease liabilities are include in in the Company’s Consolidated Balance Sheets.
Use of Estimates
In preparing the consolidated financial statements in conformity with accounting principles generally accepted in the United States of America, management is required to make estimates and assumptions that affect the reported amounts of assets and liabilities as of the date of the consolidated balance sheets and reported amounts of revenue and expenses during the reporting period. Actual results could differ from those estimates. Material estimates that are particularly susceptible to significant change in the near term relate to the determination of the allowance for credit losses, mortgage servicing rights, and the lender risk account.
Repurchase Reserve
Stock Compensation Plans
The Company recognizes compensation cost for equity-based compensation for all new or modified grants. The recognized costs are based on the fair value of the equity-based awards granted and are recognized over the vesting period.
Comprehensive Income
Accounting principles generally require that recognized revenue, expenses, gains, and losses be included in net income. Although certain changes in assets and liabilities, such as unrealized gains and losses on available-for-sale securities, are reported as a separate component of the equity section of the consolidated balance sheets, such items, along with net income, are components of comprehensive income.
Income Taxes
Deferred income tax assets and liabilities are determined using the liability (or balance sheet) method. Under this method, the net deferred tax asset or liability is determined based on the tax effects of the various temporary differences between the book and tax bases of the various balance sheet assets and liabilities and gives current recognition to changes in tax rates and laws.
The Company records uncertain tax positions in accordance with ASC Topic 740 “Income Taxes” on the basis of a two-step process whereby (1) the Company determines whether it is more likely than not that the tax positions will be sustained on the basis of the technical merits of the position and (2) for those tax positions that meet the more-likely-than-not recognition threshold, the Company recognizes the largest amount of tax benefit that is more than 50% likely to be realized upon ultimate settlement with the related tax authority.
F-14
The Company evaluates the realization of the deferred tax assets based on future taxable income, among other things. In the event that the deferred tax asset has been determined to not be realizable, a valuation allowance is established.
Transfers of Financial Assets
Transfers of financial assets are accounted for as sales when control over the assets has been surrendered. Control over transferred assets is deemed to be surrendered when (1) the assets have been isolated from the Company, (2) the transferee obtains the right (free of conditions that constrain it from taking advantage of the right) to pledge or exchange the transferred assets, and (3) the Company does not maintain effective control over the transferred assets through an agreement to repurchase them before their maturity.
Intangible Assets
Intangible assets subject to amortization are amortized over the estimated life, using a method that approximates the time the economic benefits are realized by the Company. Intangible assets are reviewed for impairment at least annually and whenever events or changes in circumstances indicate that the carrying amount of the assets may not be recoverable.
The Company acquired certain retail lending offices from an unaffiliated company during 2018. This acquisition enabled the Company to expand its geographical footprint of retail lending offices. The acquired retail lending offices included $300,000 of acquired tangible assets. The fair value of customer-related intangible assets was $11.2 million less the expected payout of $732,000 for a net value of $10.5 million.
Amortization of the intangible asset was $1.0 million in 2024 and $1.0 million in 2023. Decreases in loan production, margin, or other changes in the secondary market may impact the carrying value of the recorded intangible asset. As a result of projected decreases in loan production and margins, an impairment of $1.5 million and $137,000 was recorded in 2024 and 2023, respectively. Amortization is expected to be approximately $586,000 2.1 million and $4.5 million at December 31, 2024 and 2023, respectively.
Earnings Per share
Basic earnings per share represent net income available to common stockholders divided by the weighted- average number of common shares outstanding during each period. Diluted earnings per share reflect additional potential shares that would have been outstanding if dilutive potential common stock had been issued, as well as any adjustment to income that would result from the assumed issuance. Potential common stock that may be issued by the Company is determined using the treasury stock method.
Emerging Growth Company Status
The Company is an “emerging growth company” (“EGC”) as defined in the Jumpstart Our Business Startups Act of 2012, or the JOBS Act. Section 107 of the JOBS Act provides that an EGC can take advantage of the extended transition period when complying with new or revised accounting standards. This allows an EGC to delay adoption of certain accounting standards until those standards apply to private companies; however, the EGC can still early adopt new or revised accounting standards. We have elected to take advantage of this extended transition period, which means these financial statements, as well as financial statements we file in the future will be subject to all new or revised accounting standards generally applicable to private companies, unless stated otherwise. This decision will remain in effect until the Company loses its EGC status.
F-15
Recently Adopted Accounting Pronouncements
On January 1, 2023, the Company adopted ASU 2016-13, Financial Instruments — Credit Losses: Measurement of Credit Losses on Financial Instruments, which replaces the incurred loss methodology with an expected loss methodology that is referred to as the current expected credit loss (“CECL”) methodology. The measurement of expected credit losses under the CECL methodology is applicable to financial assets measured at amortized cost, including loan receivables, held to maturity debt securities, and accounts receivable. It also applies to off-balance-sheet credit exposures such as loan commitments. In addition, ASC 326 made changes to the accounting for available for sale debt securities.
The Company adopted ASC 326 using the modified retrospective method for all financial assets measured at amortized cost and off-balance-sheet credit exposures. The Company recorded a net decrease to retained earnings of $7.5 million as of January 1, 2023 for the cumulative effect of adopting ASC 326.
In March 2022, the FASB issued ASU 2022-02, “Financial Instruments — Credit Losses (Topic 326)”. The amendments in this ASU eliminate the accounting guidance for troubled debt restructures (“TDRs”) by creditors in Subtopic 310-40, “Receivables — Troubled Debt Restructurings by Creditors,” while enhancing disclosure requirements for certain loan refinancings and restructurings by creditors when a borrower is experiencing financial difficulty. Specifically, rather than applying the recognition and measurement guidance for TDRs, an entity must apply the loan refinancing and restructuring guidance in paragraphs 310-20-35-9 through 35-11 to determine whether a modification results in a new loan or a continuation of an existing loan. In addition, for public business entities, the amendments in this Update require that an entity disclose current- period gross charge-offs by year of origination for financing receivables and net investments in leases within the scope of Subtopic 326-20, “Financial Instruments — Credit Losses — Measured at Amortized Cost.” Adoption of this ASU on January 1, 2023 did not have a material impact on the Company’s financial results and the additional required disclosures for gross charge-offs have been included in the footnotes to the consolidated financial statements.
In June 2022, the FASB issued ASU 2022-03, “Fair Value Measurement (Topic 820).” The amendments in this ASU clarify that a contractual restriction on the sale of an equity security is not considered part of the unit of account of the equity security, and therefore, is not considered in measuring fair value. Furthermore, the amendments to this ASU clarify that an entity cannot, as a separate unit of account, recognize and measure a contractual sale restriction. The update to this ASU requires the following disclosures for equity securities: (1) The fair value of equity securities subject to contractual sale restrictions reflected in the balance sheet; (2) The nature and remaining duration of the restriction(s) and; (3) The circumstances that could cause a lapse in the restriction(s). The amendments in this Update are effective for fiscal years beginning after December 15, 2023, and interim periods within those fiscal years. The Company has concluded that the updates did not have a material impact on the Company’s financial position and/or results of operations.
In March 2022, the FASB issued ASU No. 2022-01, Derivatives and Hedging (Topic 815): Fair Value Hedging — Portfolio Layer Method (“ASU 2022-01”), which clarifies the guidance on fair value hedge accounting of interest rate risk for portfolios of financial assets. This ASU amends the guidance in ASU 2017-12 that, among other things, established the “last-of-layer” method for making the fair value hedge accounting for these portfolios more accessible. ASU 2022-01 renames that method the “portfolio layer” method and expands the scope of this guidance to allow entities to apply the portfolio layer method to portfolios of all financial assets, including both prepayable and nonprepayable financial assets. This scope expansion is consistent with the FASB’s efforts to simplify hedge accounting and allows entities to apply the same method to similar hedging strategies. ASU 2022-01 is effective for private entities for fiscal years, and interim periods within those fiscal years, beginning after December 15, 2023, with early adoption permitted. The Company has concluded that the updates did not have a material impact on the Company’s financial position and/or results of operations.
In November 2023, the FASB issued ASU 2023-07, “Segment Reporting: Improvements to Reportable Segment Disclosures, which requires enhanced disclosures on both an annual and interim basis about significant segment expenses, including for companies with only one reportable segment. This ASU is effective on a retrospective basis for fiscal years beginning after December 15, 2023, and interim periods within fiscal years beginning after December 31, 2024. The Company adopted this ASU as required as of December 31, 2024 and identified that it has two reportable segments, Retail Banking and MPP lending. Required disclosures are provided in Note 22.
F-16
New Accounting Pronouncements
In December 2023, the FASB issued ASU 2023-09, “Income Taxes: Improvement to Income Tax Disclosures (Topic 740).” This ASU requires entities to disclose specific categories in the rate reconciliations and provide additional information for reconciling items that meet a quantitative threshold. The ASU requires all entities to disclose the amount of income taxes paid, disaggregated by federal state and foreign taxes, the amount of income taxes paid disaggregated by individual jurisdictions in which income taxes paid is equal or greater than 5% of total income taxes paid. The ASU also requires that entities disclose income (loss) from continuing operations before income tax expense (or benefit) disaggregated between domestic or foreign and income tax expense (or benefit) from continuing operations disaggregated by federal, state, and foreign. This ASU is effective beginning after December 15, 2024. The Company is currently assessing the impact of the update and its operations, financial position, and disclosures.
In November 2024, the FASB issued ASU 2024-03, Income Statement—Reporting Comprehensive Income—Expense Disaggregation Disclosures (Subtopic 220-40): Disaggregation of Income Statement Expenses. The amendments in this ASU require disclosure, in the notes to financial statements, of specified information about certain costs and expenses, including (a) purchases of inventory, (b) employee compensation, (c) depreciation, (d) intangible asset amortization, and (e) depreciation, depletion, and amortization recognized as part of oil-and gas-producing activities (DD&A) (or other amounts of depletion expense) included in each relevant expense caption. The ASU is effective for public business entities for annual periods beginning after December 15, 2026, and interim periods beginning after December 15, 2027. Early adoption is allowed. The ASU can be applied prospectively. The Company is currently assessing the impact of the update and its operations, financial position, and disclosures.
Subsequent Events
Note 3 — Loans and Allowance for Credit Losses
A summary of the balances of loans follows (000s omitted):
| 2024 | 2023 | ||||||||||
| Residential | $ | $ | |||||||||
| Commercial | |||||||||||
| MPP | |||||||||||
| Total loans | |||||||||||
| Less: | |||||||||||
| Allowance for credit losses | |||||||||||
| Net deferred loan (cost)/fees | ( |
( |
|||||||||
| Net loans | $ | $ | |||||||||
The residential mortgage loan portfolio includes $173.0 million and $100.2 million of loans measured at fair value on December 31, 2024 and 2023, respectively.
F-17
Northpointe Bancshares, Inc.
Note 3 — Loans and Allowance for Credit Losses (continued)
Activity in the allowance for credit losses for 2024 is summarized as follows (000s omitted):
| Year Ended December 31, 2024 | |||||||||||||||||||||||||||||
| Residential | Commercial | MPP | Unallocated | Total | |||||||||||||||||||||||||
| Beginning balance | $ | $ | $ | $ | $ | ||||||||||||||||||||||||
| Charge-offs | ( |
( |
|||||||||||||||||||||||||||
| Recoveries | |||||||||||||||||||||||||||||
| Provision (benefit) | ( |
( |
|||||||||||||||||||||||||||
| Ending balance | $ | $ | $ | $ | $ | ||||||||||||||||||||||||
Activity in the allowance for loan losses for 2023 is summarized as follows (000s omitted):
| Year Ended December 31, 2023 | |||||||||||||||||||||||||||||
| Residential | Commercial | MPP | Unallocated | Total | |||||||||||||||||||||||||
| Beginning balance, prior to adoption of ASC 326 | $ | $ | $ | $ | $ | ||||||||||||||||||||||||
| Impact of adopting ASC 326 | ( |
( |
|||||||||||||||||||||||||||
| Charge-offs | ( |
( |
|||||||||||||||||||||||||||
| Recoveries | |||||||||||||||||||||||||||||
| Provision (benefit) | ( |
( |
( |
||||||||||||||||||||||||||
| Ending balance | $ | $ | $ | $ | $ | ||||||||||||||||||||||||
Nonaccrual Loans
The following tables present the amortized cost basis of loans on nonaccrual status and loans past due over 90 days still accruing in the held for investment portfolio, excluding those loans carried at fair value, as of December 31, 2024 (000s omitted):
| As of and for the Year Ended December 31, 2024 | |||||||||||||||||||||||||||||
| Nonaccrual with No Allowance |
Nonaccrual with Allowance |
Total Nonaccrual |
Over 90 days Accruing |
Total | |||||||||||||||||||||||||
| Residential: | |||||||||||||||||||||||||||||
| Construction and land development | $ | $ | $ | $ | $ | ||||||||||||||||||||||||
| Home equity lines of credit | |||||||||||||||||||||||||||||
| Closed end, first liens | |||||||||||||||||||||||||||||
| Closed end, second liens | |||||||||||||||||||||||||||||
| Total | $ | $ | $ | $ | $ | ||||||||||||||||||||||||
The following tables present the amortized cost basis of loans on nonaccrual status and loans past due over 90 days still accruing in the held for investment portfolio, excluding those loans carried at fair value, as of December 31, 2023 (000s omitted):
F-18
Northpointe Bancshares, Inc.
Note 3 — Loans and Allowance for Credit Losses (continued)
| As of and for the Year Ended December 31, 2023 | |||||||||||||||||||||||||||||
| Nonaccrual with No Allowance |
Nonaccrual with Allowance |
Total Nonaccrual |
Over 90 days Accruing |
Total | |||||||||||||||||||||||||
| Residential: | |||||||||||||||||||||||||||||
| Construction and land development | $ | $ | $ | $ | $ | ||||||||||||||||||||||||
| Home equity lines of credit | |||||||||||||||||||||||||||||
| Closed end, first liens | |||||||||||||||||||||||||||||
| Closed end, second liens | |||||||||||||||||||||||||||||
| Total | $ | $ | $ | $ | $ | ||||||||||||||||||||||||
The Bank has not recognized any material interest income on nonaccrual loans during 2024 or 2023.
Collateral dependent loans are loans for which the repayment is expected to be provided substantially through the sale of the collateral and the borrower is experiencing financial difficulty. The allowance is calculated on an individual loan basis of the shortfall between the fair value of the loan’s collateral, which is adjusted for selling costs, and the loan’s amortized cost. If the fair value of the collateral exceeds the loan’s amortized cost, no allowance is necessary.
The amortized cost of collateral dependent loans by class as of December 31, 2024 was as follows (000s omitted):
| 2024 | |||||||||||||||||
| Collateral Type | |||||||||||||||||
| Real Estate | Other | Allowance Allocated |
|||||||||||||||
| Residential: | |||||||||||||||||
| Construction and land development | $ | $ | $ | ||||||||||||||
| Home equity lines of credit | |||||||||||||||||
| Closed end, first liens | |||||||||||||||||
| Closed end, second liens | |||||||||||||||||
| Commercial | $ | ||||||||||||||||
| Total | $ | $ | $ | ||||||||||||||
| 2023 | |||||||||||||||||
| Collateral Type | |||||||||||||||||
| Real Estate | Other | Allowance Allocated |
|||||||||||||||
| Residential: | |||||||||||||||||
| Construction and land development | $ | $ | $ | ||||||||||||||
| Home equity lines of credit | |||||||||||||||||
| Closed end, first liens | |||||||||||||||||
| Closed end, second liens | |||||||||||||||||
| Total | $ | $ | $ | ||||||||||||||
F-19
Northpointe Bancshares, Inc.
Note 3 — Loans and Allowance for Credit Losses (continued)
Age Analysis of Loans
The following tables detail the age analysis of loans, excluding those loans carried at fair value, at December 31, 2024 and 2023 (000s omitted):
| December 31, 2024 | |||||||||||||||||||||||||||||||||||
| 30 - 59 Days Past Due |
60 - 89 Days Past Due |
Greater than 90 Days |
Total Past Due |
Current | Total Loans |
||||||||||||||||||||||||||||||
| Residential: | |||||||||||||||||||||||||||||||||||
| Construction and land development | $ | $ | $ | $ | $ | $ | |||||||||||||||||||||||||||||
| Home equity lines of credit | |||||||||||||||||||||||||||||||||||
| Closed end, first liens | |||||||||||||||||||||||||||||||||||
| Closed end, second liens | |||||||||||||||||||||||||||||||||||
| Commercial | |||||||||||||||||||||||||||||||||||
| MPP | |||||||||||||||||||||||||||||||||||
| Total | $ | $ | $ | $ | $ | $ | |||||||||||||||||||||||||||||
| December 31, 2023 | |||||||||||||||||||||||||||||||||||
| 30 - 59 Days Past Due |
60 - 89 Days Past Due |
Greater than 90 Days |
Total Past Due |
Current | Total Loans |
||||||||||||||||||||||||||||||
| Residential: | |||||||||||||||||||||||||||||||||||
| Construction and land development | $ | $ | $ | $ | $ | $ | |||||||||||||||||||||||||||||
| Home equity lines of credit | |||||||||||||||||||||||||||||||||||
| Closed end, first liens | |||||||||||||||||||||||||||||||||||
| Closed end, second liens | |||||||||||||||||||||||||||||||||||
| Commercial | |||||||||||||||||||||||||||||||||||
| MPP | |||||||||||||||||||||||||||||||||||
| Total | $ | $ | $ | $ | $ | $ | |||||||||||||||||||||||||||||
F-20
Northpointe Bancshares, Inc.
Note 3 — Loans and Allowance for Credit Losses (continued)
Modifications to Borrowers Experiencing Financial Difficulty
On occasion, the Company modifies loans to borrowers in financial distress by providing principal forgiveness, term extensions, interest rate reductions, or payment delays. When principal forgiveness is provided, the amount of forgiveness is charged-off against the allowance for credit losses. In some cases, the Company provides multiple types of concessions on one loan.
During 2024, there were $4.5 million loans: 14 closed end, first liens, for $3.9 million, 1 construction and land development for $255,000 , 1 home equity line of credit for $134,000 , and 1 closed end, second lien for $153,000 , that were both experiencing financial difficulty and modified during the year. These loans were a combination of term extensions and interest rate reductions and were on nonaccrual status at time of modification. During 2023, there were $2.2 million loans: 5 closed end, first lien loans for $1.7 million and 1 home equity loan for $463,000 , that were both experiencing financial difficulty and modified during the year. These loans were a combination of term extension and interest rate reduction. During 2023, all closed end, first liens loan were on nonaccrual status at time of modification and the home equity line of credit was on accrual status at time of modification. There were no material modifications to borrowers experiencing financial difficulty within the previous twelve months that became 30 days or more past due during the years ended December 31, 2024 and 2023.
Credit Quality Indicators
The Company categorized each loan into credit risk categories based on current financial information, overall debt service coverage, comparison against industry averages, collateral coverage, historical payment experience, and current economic trends. Residential real estate is evaluated for credit risk based on performing or non-performing classification. The Company uses the following definitions for credit risk ratings:
Performing
Residential real estate credits not covered by the non-performing definition below.
Non-performing
Residential real estate loans classified as non-performing are generally loans on nonaccrual status.
Pass
Commercial credits not covered by the definitions below are pass credits, which are not considered to be adversely rated.
Special Mention
Loans classified as special mention, or watch credits, have a potential weakness or weaknesses that deserves management’s close attention. If left uncorrected, these potential weaknesses may result in deterioration of the repayment prospects for the loan or of the institution’s credit position at some future date.
Substandard
Loans classified as substandard are inadequately protected by the current net worth and paying capacity of the obligor or of the collateral pledged, if any. Loans so classified have a well-defined weakness or weaknesses that jeopardize the liquidation of the debt. They are characterized by the distinct possibility that the institution may sustain some loss if the deficiencies are not corrected.
F-21
Northpointe Bancshares, Inc.
Note 3 — Loans and Allowance for Credit Losses (continued)
The following table reflects amortized cost basis of loans and year to date charge-offs (excluding those loans carried at fair value) as of December 31, 2024 based on year of origination (000s omitted):
| 2024 | 2023 | 2022 | 2021 | 2020 | Prior | Revolving Loans Amortized Cost Basis |
Total | ||||||||||||||||||||||||||||||||||||||||
| Construction and Land Development: | |||||||||||||||||||||||||||||||||||||||||||||||
| Performing | $ | $ | $ | $ | $ | $ | $ | $ | |||||||||||||||||||||||||||||||||||||||
| Nonperforming | |||||||||||||||||||||||||||||||||||||||||||||||
| Total | |||||||||||||||||||||||||||||||||||||||||||||||
| Gross charge-offs | |||||||||||||||||||||||||||||||||||||||||||||||
| Home Equity Lines of credit: | |||||||||||||||||||||||||||||||||||||||||||||||
| Performing | |||||||||||||||||||||||||||||||||||||||||||||||
| Nonperforming | |||||||||||||||||||||||||||||||||||||||||||||||
| Total | |||||||||||||||||||||||||||||||||||||||||||||||
| Gross charge-offs | |||||||||||||||||||||||||||||||||||||||||||||||
| First liens, closed end loans: | |||||||||||||||||||||||||||||||||||||||||||||||
| Performing | |||||||||||||||||||||||||||||||||||||||||||||||
| Nonperforming | |||||||||||||||||||||||||||||||||||||||||||||||
| Total | |||||||||||||||||||||||||||||||||||||||||||||||
| Gross charge-offs | |||||||||||||||||||||||||||||||||||||||||||||||
| Second liens, closed end loans: | |||||||||||||||||||||||||||||||||||||||||||||||
| Performing | |||||||||||||||||||||||||||||||||||||||||||||||
| Nonperforming | |||||||||||||||||||||||||||||||||||||||||||||||
| Total | |||||||||||||||||||||||||||||||||||||||||||||||
| Gross charge-offs | |||||||||||||||||||||||||||||||||||||||||||||||
| Commercial: Risk Rating | |||||||||||||||||||||||||||||||||||||||||||||||
| Pass | |||||||||||||||||||||||||||||||||||||||||||||||
| Special mention | |||||||||||||||||||||||||||||||||||||||||||||||
| Total | |||||||||||||||||||||||||||||||||||||||||||||||
| Gross charge-offs | |||||||||||||||||||||||||||||||||||||||||||||||
| MPP: Risk Rating | |||||||||||||||||||||||||||||||||||||||||||||||
| Pass | |||||||||||||||||||||||||||||||||||||||||||||||
| Special mention | |||||||||||||||||||||||||||||||||||||||||||||||
| Total | |||||||||||||||||||||||||||||||||||||||||||||||
| Gross charge-offs | |||||||||||||||||||||||||||||||||||||||||||||||
| Grand Total | $ | $ | $ | $ | $ | $ | $ | $ | |||||||||||||||||||||||||||||||||||||||
| Grand Total Gross charge-offs | $ | $ | $ | $ | $ | $ | $ | $ | |||||||||||||||||||||||||||||||||||||||
There were no revolving loans converted to term loans during 2024.
F-22
Northpointe Bancshares, Inc.
Note 3 — Loans and Allowance for Credit Losses (continued)
The following table reflects amortized cost basis of loans and year to date charge-offs as of December 31, 2023 based on year of origination (000s omitted):
| 2023 | 2022 | 2021 | 2020 | 2019 | Prior | Revolving Loans Amortized Cost Basis |
Total | ||||||||||||||||||||||||||||||||||||||||
| Construction and Land Development: | |||||||||||||||||||||||||||||||||||||||||||||||
| Performing | $ | $ | $ | $ | $ | $ | $ | $ | |||||||||||||||||||||||||||||||||||||||
| Nonperforming | |||||||||||||||||||||||||||||||||||||||||||||||
| Total | |||||||||||||||||||||||||||||||||||||||||||||||
| Gross charge-offs | |||||||||||||||||||||||||||||||||||||||||||||||
| Home Equity Lines of credit: | |||||||||||||||||||||||||||||||||||||||||||||||
| Performing | |||||||||||||||||||||||||||||||||||||||||||||||
| Nonperforming | |||||||||||||||||||||||||||||||||||||||||||||||
| Total | |||||||||||||||||||||||||||||||||||||||||||||||
| Gross charge-offs | |||||||||||||||||||||||||||||||||||||||||||||||
| First liens, closed end loans: | |||||||||||||||||||||||||||||||||||||||||||||||
| Performing | |||||||||||||||||||||||||||||||||||||||||||||||
| Nonperforming | |||||||||||||||||||||||||||||||||||||||||||||||
| Total | |||||||||||||||||||||||||||||||||||||||||||||||
| Gross charge-offs | |||||||||||||||||||||||||||||||||||||||||||||||
| Second liens, closed end loans: | |||||||||||||||||||||||||||||||||||||||||||||||
| Performing | |||||||||||||||||||||||||||||||||||||||||||||||
| Nonperforming | |||||||||||||||||||||||||||||||||||||||||||||||
| Total | |||||||||||||||||||||||||||||||||||||||||||||||
| Gross charge-offs | |||||||||||||||||||||||||||||||||||||||||||||||
| Commercial: Risk Rating | |||||||||||||||||||||||||||||||||||||||||||||||
| Pass | |||||||||||||||||||||||||||||||||||||||||||||||
| Special mention | |||||||||||||||||||||||||||||||||||||||||||||||
| Total | |||||||||||||||||||||||||||||||||||||||||||||||
| Gross charge-offs | |||||||||||||||||||||||||||||||||||||||||||||||
| MPP: Risk Rating | |||||||||||||||||||||||||||||||||||||||||||||||
| Pass | |||||||||||||||||||||||||||||||||||||||||||||||
| Special mention | |||||||||||||||||||||||||||||||||||||||||||||||
| Total | |||||||||||||||||||||||||||||||||||||||||||||||
| Gross charge-offs | |||||||||||||||||||||||||||||||||||||||||||||||
| Grand Total | $ | $ | $ | $ | $ | $ | $ | $ | |||||||||||||||||||||||||||||||||||||||
| Grand Total Gross charge-offs | $ | $ | $ | $ | $ | $ | $ | $ | |||||||||||||||||||||||||||||||||||||||
There were no revolving loans converted to term loans during 2023.
F-23
Northpointe Bancshares, Inc.
Note 4 — Bank Premises and Equipment, Net
A summary of the cost and accumulated depreciation of premises and equipment follows (000s omitted):
| 2024 | 2023 | ||||||||||
| Land | $ | $ | |||||||||
| Leasehold improvements | |||||||||||
| Buildings and building improvements | |||||||||||
| Furniture, fixtures, and equipment | |||||||||||
| Construction in progress | |||||||||||
| Total cost | |||||||||||
| Accumulated depreciation | ( |
( |
|||||||||
| Net | $ | $ | |||||||||
Depreciation expense for the years ended December 31, 2024 and 2023 amounted to $2.8 million and $3.0 million, respectively.
Future undiscounted lease payments for operating leases with initial terms of one year of more as of December 31, 2024 are as follows (000s omitted):
| 2025 | $ | ||||
| 2026 | |||||
| 2027 | |||||
| 2028 | |||||
| 2029 | |||||
| Total undiscounted lease payments | |||||
| Less discount to net present value | ( |
||||
| Total operating lease liabilities | $ | ||||
The lease liability is included in other liabilities in the Company’s Consolidated Balance Sheet.
The weighted average remaining discount rate was 3.43 % and weighted average remaining life was 2.7 years for the year ended December 31, 2024.
The leases contain options to extend for periods from 3 to 4 years . The cost of such rentals is not included above. Total rent expense for the years ended December 31, 2024 and 2023 amounted to $1.7 million and $3.1 million, respectively.
The Company also leases portions of its main office location to third parties. The amounts included in are net of rental income of $1.1 million and $735,000 for the years ended December 31, 2024 and 2023, respectively.
Future income from non-cancelable lease agreements in effect at December 31, 2024 is as follows (000s omitted):
| 2025 | $ | ||||
| 2026 | |||||
| 2027 | |||||
| 2028 | |||||
| 2029 | |||||
| Thereafter | |||||
| Total | $ | ||||
F-24
Northpointe Bancshares, Inc.
Note 5 — Mortgage Servicing Rights
Loans serviced for others are not included in the accompanying consolidated balance sheets. The unpaid principal balances of mortgage loans and other loans serviced for others were approximately $1.3 billion and $6.9 billion at December 31, 2024 and 2023, respectively. In addition, approximately $3.0 billion and $3.5 billion at December 31, 2024 and 2023, respectively, of loans were sub-serviced on behalf of other unaffiliated investors. The Company has an ongoing relationship to sell servicing rights to a buyer on a routine basis when the loans are sold to the agencies while maintaining a subservicing relationship. Under this relationship, the servicing is conducted in the name of Northpointe Bank.
The following summarizes the loan servicing fees which are reported in Loan Servicing Fees in the Company’s Consolidated Statements of Income (000s omitted):
| 2024 | 2023 | ||||||||||
| $ | $ | ||||||||||
| Other fees | |||||||||||
| Total | $ | $ | |||||||||
At December 31, 2024 the fair value of mortgage servicing rights was determined using discount rates between 10.0 % and 12.0 %, average cost of servicing between $70 and $85 per file per year, and a prepayment speed of 9.7 %. At December 31, 2023 the fair value of mortgage servicing rights was determined using discount rates between 10.0 % and 12.5 %, average cost of servicing between $70 and $85 per file per year, and a prepayment speed of 7.2 %.
The following summarizes mortgage servicing rights capitalized and amortized (000s omitted):
| 2024 | 2023 | ||||||||||
| Balance – Beginning of year | $ | $ | |||||||||
| Additions | |||||||||||
| Paid in full loans | ( |
( |
|||||||||
| Change in fair value | ( |
( |
|||||||||
| Proceeds from sale | ( |
||||||||||
| Bulk purchases | |||||||||||
| Loss on sale | ( |
||||||||||
| Balance – End of year | $ | $ | |||||||||
During 2024, the Company did not purchase any mortgage servicing rights. During 2023, the Company acquired one bulk purchase of mortgage servicing rights with an unpaid principal loan balance of $298.0 million for $2.7 million in mortgage servicing right assets.
F-25
During April and May 2024, the Company performed one bulk sale of mortgage servicing rights with an unpaid principal balance of $5.7 billion. The associated fair value of the assets and proceeds received of the mortgage servicing rights assets was $80.8 million. Related to this transaction, in April 2024, the Bank repurchased a pool of GNMA delinquent loans with unpaid principal balances totaling $36.0 million. All loans in this pool are guaranteed by the Federal Housing Administration (“FHA”), the Department of Agriculture Rural Development (“RD”) or the department of Veteran Affairs (“VA”). There were no bulk mortgage servicing rights sales in 2023.
The following table summarizes the hypothetical effect on the fair value of servicing rights using adverse changes of 10.0% and 20.0% to the weighted-average of certain significant assumptions used in valuing these assets (000s omitted):
| 2024 | 2023 | ||||||||||||||||||||||||||||||||||
| Actual | 10% Adverse Change |
20% Adverse Change |
Actual | 10% Adverse Change |
20% Adverse Change |
||||||||||||||||||||||||||||||
| Discount rate change | % | $ | $ | % | $ | $ | |||||||||||||||||||||||||||||
| Constant prepayment rate | % | % | |||||||||||||||||||||||||||||||||
| Cost to service | $ | $ | |||||||||||||||||||||||||||||||||
Note 6 — Derivative Financial Instruments
Forward contracts are contracts for delayed delivery of loans or mortgage-backed securities in which the seller agrees to make delivery at a future date of a specified instrument, at a specified price or yield. Risks arise from the possible inability of the Company to compile a portfolio of loans and from movements in interest rates. These contracts are used primarily to reduce the exposure to interest rate fluctuations for loans in progress and in loan inventory held for sale to investors. Most forward contracts are for terms of 30 days to 90 days. The Company had outstanding forward contracts of approximately $110.6 million and $169.4 million at December 31, 2024 and 2023, respectively. Forward commitments represent forward contracts, closed held for sale loans with a committed investor, and pair-off contracts.
Interest rate lock commitments, which are included in the commitments to extend credit, represent commitments to lend to customers at predetermined interest rates.
The following table presents the recorded gain/(loss) on derivative financial instruments at December 31 (000s omitted):
| Year ended December 31, | |||||||||||
| 2024 | 2023 | ||||||||||
| Interest rate-lock commitments | $ | $ | |||||||||
| Forward commitments | ( |
( |
|||||||||
The following table provide details on the Company’s derivative financial instruments at December 31 (000s omitted):
| 2024 | |||||||||||||||||
| Notional Amount | |||||||||||||||||
| Interest rate-lock commitments | $ | ||||||||||||||||
| Forward commitments | |||||||||||||||||
| Total | $ | ||||||||||||||||
| 2023 | ||||||||||||||||||||||||||
| Notional Amount | Asset | Liability | ||||||||||||||||||||||||
| Interest rate-lock commitments | $ | |||||||||||||||||||||||||
| Forward commitments | ||||||||||||||||||||||||||
| Total | $ | $ | $ | |||||||||||||||||||||||
F-26
Northpointe Bancshares, Inc.
Note 6 — Derivative Financial Instruments (continued)
As of December 31, 2024 and 2023, the counterparty collateral asset balance was $0 and $1.3 million, respectively and was included in other assets in the consolidated balance sheets. As of December 31, 2024 and 2023, the counterparty collateral liability balance was $43,000 and $100,000 and was included in accruals and other liabilities in the consolidated balance sheets.
Note 7 — Deposits
The following is a summary of the distribution of deposits at December 31, (000s omitted):
| 2024 | 2023 | ||||||||||
| Noninterest-bearing deposits | $ | $ | |||||||||
| Interest-bearing demand deposits | |||||||||||
| Savings and money market accounts | |||||||||||
| Time: | |||||||||||
| Under $250,000 | |||||||||||
| $250,000 and over | |||||||||||
| Total | $ | $ | |||||||||
Brokered time deposits totaled $1.82 billion and $1.47 billion at December 31, 2024 and 2023, respectively.
At December 31, 2024, the scheduled maturities of time deposits are as follows (000s omitted):
| 2025 | $ | ||||
| 2026 | |||||
| 2027 | |||||
| 2028 | |||||
| 2029 | |||||
| Thereafter | |||||
| Total | $ | ||||
Note 8 — Borrowings
The Bank has an advance agreement with the FHLB. At December 31, 2024, the Bank had 34 advances totaling $1.3 billion carrying a fixed interest rate ranging between 104 and 484 basis points with scheduled maturities between 4 months and 9.17 years. The weighted average rate was 3.83 % in 2024. At December 31, 2023, the Bank had 35 advances totaling $1.3 billion carrying a fixed interest rate ranging between 104 and 474 basis points with scheduled maturities between 5 months and 9.3 years. The weighted average rate was 3.36 % in 2023.
The advances are collateralized by approximately $3.2 billion and $2.5 billion of mortgage loans and loans held for sale as of December 31, 2024 and 2023, respectively, under an agreement which calls for specific identification of pledged loans. Included in the above, advances totaling $10.0 million and $175.0 million are putable advances.
At December 31, 2024, the scheduled maturities of the advances are as follows (000s omitted):
| 2025 | $ | ||||
| 2026 | |||||
| 2027 | |||||
| 2028 | |||||
| 2029 | |||||
| Thereafter | |||||
| Total | $ | ||||
F-27
The Bank recognized a $1.7 million of gain on debt extinguishment of a $50.0 million FHLB advance in the fourth quarter of 2024. This gain is reported in other noninterest income in the Consolidated Statement of Income. In January 2025, the Bank executed another extinguishment of $102.5 million in FHLB advances, recognizing a $2.0 million gain on extinguishment.
The Bank also has a line of credit included under the collateral agreement mentioned above, allowing borrowing up to $50.0 million. The interest rate on the line of credit is a floating rate determined by the FHLB and the line of credit matures on May 10, 2025. The Bank had no
Note 9 — Employee Benefits
The Company sponsors a 401(K) plan which contains an employee stock ownership plan (ESOP) investment option. The 401(k) Plan is available to all employees, on the 1st of the month following 90 days of employment. Participants in the plan have the option to contribute from 0 % to 100 % of their annual compensation, up to the IRS allowable limits. FICA taxes must be paid based on total compensation. The Company matches 60 % of participant contributions up to 7 % of gross pay. The Company’s matching contributions were $700,000 and $1.7 million for the years ended December 31, 2024 and 2023, respectively. Participants are immediately 100 % vested in salary and rollover contributions and any income or loss thereon. Vesting in the matching contributions is based on years of service. Participants vest in contributions made by the Company 20 % after one year of service and another 20 % per year per until they become fully vested after five years of service. If a participant is not fully vested on their termination date, the non-vested amount is forfeited. Forfeitures are used to reduce company contributions and/or to pay administrative expenses of the plan.
The ESOP held 951,600 shares and 1,021,600 shares of the Company’s common stock for the years ended December 31, 2024 and 2023, respectively. During 2024 and 2023, all shares have been allocated to participants. In 2024, the ESOP did not purchase any shares. In 2023, the ESOP did not purchase any shares. During 2024, the Company repurchased 70,000 shares at $1.10 per share from the ESOP. During 2023, the Company purchased 56,000 shares at $1.10 per share from the ESOP. Dividends on ESOP shares are reinvested and allocated to the participants. The fair value to repurchase the shares held was approximately $13.7 million at December 31, 2024 and $11.2 million at December 31, 2023.
The Company has a self-insured medical insurance plan covering all of its eligible employees. The Company’s individual excess risk benefit level per employee was $175,000 (with no aggregate exposure limitation) at December 31, 2024. Losses in excess of the limitation are covered by reinsurance. Amounts expensed by the Company under the plan were approximately $4.6 million and $8.1 million for the years ended December 31, 2024 and 2023, respectively, recorded in salaries and employee benefits on the consolidated statement of income. The Company recorded an accrual of approximately $390,000 and $528,000 at December 31, 2024 and 2023, respectively, for known claims and estimated claims incurred but not reported, reported in accrued and other liabilities on the consolidated balance sheets.
Note 10 — Stock Compensation Plans
The Company has three share based compensation plans, which are described below. No
The Company has a stock option plan for its non-employee directors, executive officers and certain employees under which options may be granted at not less than the fair value of the underlying stock on the date of the grant. These options are subject to a vesting schedule under which one-third vests at each anniversary date of the grant. Under the stock option plan, the Company may grant options to its directors for up to 500,000 shares of common stock and up to 1,000,000 shares of common stock to its executive officers and certain employees.
All options granted expire within 10 years of the date of grant, subject to certain cancellation provisions related to an individual’s affiliation with the Company.
F-28
The calculated value of each option award is estimated on the date of grant using a Black-Scholes option valuation model that uses the weighted average assumptions. Expected volatilities are based on similar volatilities of comparable banks. The Company uses comparable bank data to estimate option exercise and employee termination within the valuation model. The risk-free rate for periods within the contractual life of the option is based on the U.S. Treasury yield curve in effect at the time of grant. There were no
A summary of option activity under the Plan for the year ended December 31, 2024 is presented below:
| Options | Number of Shares |
Weighted Average Exercise Price | Weighted Average Remaining Contractual Term (in years) | |||||||||||||||||
| Outstanding at January 1, 2023 | ||||||||||||||||||||
| Granted | ||||||||||||||||||||
| Exercised | ( |
( |
||||||||||||||||||
| Forfeited or expired | ||||||||||||||||||||
| Outstanding at December 31, 2024 | ||||||||||||||||||||
| Vested at December 31, 2024 | ||||||||||||||||||||
The total intrinsic value of the options exercised during the year ended December 31, 2024 was approximately $576,000 . No options were exercised in 2023. The total intrinsic value of the options outstanding at December 31, 2024 and 2023 was approximately $236,000 and $718,000 , respectively.
As of December 31, 2024 and 2023, there was no
The Company also has a stock appreciation rights plan for executive officers and certain employees. Stock appreciation rights are primarily granted with a price equal to the market value of common stock on the date of the grant. These awards generally have a five year vesting schedule but may vest early in accordance with accelerated vesting provisions. Compensation expense is recognized over the vesting period of the awards based on the fair value of the stock. The Bank utilizes a third party valuation service for the measurement of fair value of the Company’s stock price as provided for in the Employee Stock Ownership Plan Report. On December 24, 2024, the Company terminated 837,500 shares of outstanding executive officer stock appreciation right awards and replaced with 849,530 shares of restricted stock units.
A summary of stock appreciation right awards for the year ended December 31, 2024 is as follows:
| Stock Awards | Number of Shares |
Weighted Average Exercise Price |
||||||||||||
| Non-vested at January 1, 2023 | $ | |||||||||||||
| Granted | ||||||||||||||
| Exercised | ( |
|||||||||||||
| Forfeited or expired | ( |
|||||||||||||
| Outstanding at December 31, 2024 | $ | |||||||||||||
The Company also has a restricted stock award plan which was implemented during 2024. Restricted stock awards generally have vesting periods of three years with vesting at the rate of one-third each year. Restricted stock awards granted to the Company’s Chief Executive Officer in connection with the Company’s initial public offering were assigned a five year vesting period. Restricted stock awards have no other performance conditions required for vesting.
F-29
A summary of changes in the Company’s nonvested restricted stock awards for the year follows ($000s omitted):
| Nonvested Stock Awards | Number of Shares |
Weighted Average Grant-Date Fair Value | Aggregate Intrinsic Value | |||||||||||||||||
| Outstanding at January 1, 2024 | ||||||||||||||||||||
| Granted | $ |
$ | ||||||||||||||||||
| Exercised | — | |||||||||||||||||||
| Forfeited or expired | — | |||||||||||||||||||
| Outstanding at December 31, 2024 | $ |
$ | ||||||||||||||||||
Compensation cost related to restricted stock awards totaled $177,000 and $0 for 2024 and 2023, respectively.
Note 11 — Subordinated Debentures
On February 13, 2017, the Company issued $8.5 million of subordinated notes due March 1, 2027. All notes were redeemed and repaid on December 1, 2023.
On September 27, 2017, the Company issued $8.75 million of subordinated notes due September 30, 2027. All notes were redeemed and repaid on October 1, 2023.
On September 28, 2018, the Bank issued $15.0 million of subordinated notes due October 1, 2028. The notes are redeemable on October 1, 2023. Interest payments are due April 1 and October 1 of each year at a fixed rate of 6.875 % through October 1, 2023 and converted to a variable rate of the three-month LIBOR plus 3.765 % with payments due quarterly January 1, April 1, July 1, and October 1 of each year. The notes include fall back language to determine an alternative index rate calculation if the three-month LIBOR rate index is unavailable. The alternative index rate is three-month CME Term SOFR plus 4.03 % (an effective rate of 8.718 % as of December 31, 2024). The cash raised by the Bank was used as a source of capital for the Bank’s organic growth. All notes were redeemed and repaid in January 2025.
On September 9, 2019, the Company issued $20.0 million of subordinated notes due September 30, 2029. The notes become redeemable on September 30, 2024. Interest payments are due March 30 and September 30 of each year at a fixed rate of 6.0 % through September 30, 2024 and convert to a variable rate of the three-month SOFR plus 4.905 % with payments due quarterly March 30, June 30, September 30, and December 30 of each year. In the event three-month SOFR is less than zero, three-month term SOFR shall be deemed to be zero. The cash raised by the Company was used as a source of capital for the Bank’s organic growth, and general corporate matters. All notes were redeemed in and repaid in 2024.
On August 22, 2024, the Company issued $25.0 million of subordinated notes due September 1, 2034. The notes become redeemable on September 1, 2029. Interest payments are due on March 1 and September 1 of each year at a fixed rate of 9.0 % through September 1, 2029 and convert to a variable rate of three month SOFR plus 5.50 % with payments due quarterly. The cash raised by the Bank was used as a source of capital for the Bank’s organic growth.
As of December 31, 2024, maturities of subordinated debt were as follows (000s omitted):
| 2025 | $ | ||||
| 2029 | |||||
| 2034 | |||||
| Total | |||||
| Less unamortized deferred costs | |||||
| Total maturities, net unamortized deferred costs | $ | ||||
F-30
Northpointe Bancshares, Inc.
Note 12 — Subordinated Debentures Issued through Trusts
Northpointe Statutory Trust I, a business trust, sold 5,000 1,000 per trust preferred security in a March 17, 2004 pooled offering. The proceeds from the sale of the trust preferred securities were used by Northpointe Statutory Trust I to purchase an equivalent amount of subordinated debentures from Northpointe Bancshares, Inc. The subordinated debentures issued by the Company carry a floating rate equal to the three-month CME Term SOFR plus tenor spread adjustment of 0.26161 % plus 2.79 % or three-month LIBOR plus 2.79 % (an effective rate of 7.74 % and 8.38 % at December 31, 2024 and 2023, respectively), have a stated maturity of 30 years and, in effect, are guaranteed by Northpointe Bancshares, Inc. The subordinated debentures include fall back language to determine an alternative index rate calculation if the three-month LIBOR rate index is unavailable; however, the alternative index rate must be based on a three-month product. The proceeds from the offering of the subordinated debentures were used to inject capital into the Bank.
The subordinated debentures are carried on the consolidated balance sheets as a liability. The related interest expense, including amortization of the issuance cost, is recorded on the consolidated statements of income. The securities are redeemable at par after five years . Distributions on the subordinated debentures are payable quarterly. Under certain circumstances, distributions may be deferred for up to 20 calendar quarters. However, during any such deferrals, interest accrues on any unpaid distributions at the stated rate per annum.
Note 13 — Issuance of Preferred Stock
On December 30, 2021, the Company issued $25.0 million of 7.25 % Fixed-to-Floating Rate Non- Cumulative Perpetual Preferred Stock, Series B, no par value, with a liquidation preference of $1,000 per share. When, as, and if declared by the board of directors of the Company, dividends will be payable at an annual rate of 7.25 %, payable quarterly, in arrears. The cash raised by the Company was used as a source of capital for the Bank’s organic growth, and general corporate matters.
On December 29, 2020, the Company issued $95.0 million of 8.25 % Fixed-to-Floating Rate Non- Cumulative Perpetual Preferred Stock, Series A, no par value, with a liquidation preference of $1,000 per share. When, as, and if declared by the board of directors of the Company, dividends will be payable at an annual rate of 8.25 %, payable quarterly, in arrears. The cash raised by the Company was used as a source of capital for the Bank’s organic growth, and general corporate matters. During 2024, the Company redeemed 13,000 shares for $11.6 million.
Note 14 — Off-balance-sheet Activities
Credit-related Financial Instruments
The Company is a party to credit-related financial instruments with off-balance-sheet risk in the normal course of business to meet the financing needs of its customers. These financial instruments include commitments to extend credit, standby letters of credit, and commercial letters of credit. Such commitments involve, to varying degrees, elements of credit and interest rate risk in excess of the amount recognized in the consolidated balance sheet.
The Company’s exposure to credit loss is represented by the contractual amount of these commitments. The Company follows the same credit policies in making commitments as it does for on-balance-sheet instruments.
At December 31, 2024 and 2023, the following financial instruments were outstanding whose contract amounts represent credit risk (000s omitted):
| Contract Amount | |||||||||||
| 2024 | 2023 | ||||||||||
| Commitments to grant loans | $ | $ | |||||||||
| Unfunded commitments under lines of credit | |||||||||||
F-31
Commitments to extend credit are agreements to lend to a customer as long as there is no violation of any condition established in the contract. Commitments generally have fixed expiration dates or other termination clauses and may require payment of a fee. The commitments for equity lines of credit may expire without being drawn upon. Therefore, the total commitment amounts do not necessarily represent future cash requirements. The amount of collateral obtained, if it is deemed necessary by the Company, is based on management’s credit evaluation of the customer.
Unfunded commitments under lines of credit are commitments for possible future extensions of credit to existing customers. These lines of credit are collateralized and usually do not contain a specified maturity date and may not be drawn upon to the total extent to which the Company is committed.
The Company is required to consider expected credit losses associated with unfunded commitments. Any allowance for unfunded commitment credit exposure is reported in other liabilities on the consolidated balance sheets and is increased or decreased through the provision (benefit) for credit losses on the consolidated statement of income. The calculated allowance for unfunded commitments was $385,000 as of December 31, 2024 and provision for credit losses relating to unfunded commitments was a benefit of $1.2 million for the year ended December 31, 2024. The calculated allowance for unfunded commitments were $1.6 million as of December 31, 2023 and provision for credit losses relating to unfunded commitments was $1.1 million for the year ended December 31, 2023.
Collateral Requirements
To reduce credit risk related to the use of credit-related financial instruments, the Company might deem it necessary to obtain collateral. The amount and nature of the collateral obtained are based on the Company’s credit evaluation of the customer. Collateral held varies but may include cash, securities, accounts receivable, inventory, property, plant, and equipment, and real estate.
If the counterparty does not have the right and ability to redeem the collateral or the Company is permitted to sell or re-pledge the collateral on short notice, the Company records the collateral in its consolidated balance sheet at fair value with a corresponding obligation to return it.
Legal Contingencies
Various legal claims also arise from time to time in the normal course of business which, in the opinion of management, will have no material effect on the Company’s consolidated financial statements.
Note 15 — Income Taxes
The components of the income tax provision are detailed as follows (000s omitted):
| 2024 | 2023 | ||||||||||
| Current income tax expense | $ | $ | |||||||||
| Deferred tax expense | ( |
( |
|||||||||
| Total income tax expense | $ | $ | |||||||||
A reconciliation of taxes on income from the statutory income tax rate to income tax expense is as follows (000s omitted):
| 2024 | 2023 | ||||||||||||||||||||||
| Amount | Percent | Amount | Percent | ||||||||||||||||||||
| Income tax expense, computed at statutory rate of pretax income | $ | % | $ | % | |||||||||||||||||||
| Effect of nontaxable income and nondeductible expenses | % | % | |||||||||||||||||||||
| Other | % | % | |||||||||||||||||||||
| Total income tax expense | $ | % | $ | % | |||||||||||||||||||
F-32
Deferred tax assets and liabilities consisted of the following as of December 31 (000s omitted):
| 2024 | 2023 | ||||||||||
| Allowance for credit losses | $ | $ | |||||||||
| Accrued expenses and other reserve accounts | |||||||||||
| Nonaccrual loan interest | |||||||||||
| Stock compensation | |||||||||||
| Unrealized loss on debt securities available for sale | |||||||||||
| Other deferred tax assets | |||||||||||
| Total deferred tax assets | |||||||||||
| Mortgage servicing rights | |||||||||||
| Fixed assets | |||||||||||
| Section 481(a) adjustment | |||||||||||
| Goodwill and intangibles | |||||||||||
| Deferred Loan Costs/Fees | |||||||||||
| Other deferred tax liabilities | |||||||||||
| Total deferred tax liabilities | |||||||||||
| Net deferred tax liability | $ | ( |
$ | ( |
|||||||
The Company and its subsidiaries file consolidated tax returns. The Company accounts for income taxes in accordance with income tax accounting guidance (ASC 740, Income Taxes). The income tax accounting guidance results in two components of income tax expense: current and deferred. Current income tax expense reflects taxes to be paid or refunded for the current period by applying the provisions of the enacted tax law to the taxable income or excess of deductions over revenues. The Company determines deferred income taxes using the liability (or balance sheet) method. Under this method, the net deferred tax asset or liability is based on the tax effects of the differences between the book and tax bases of assets and liabilities, and enacted changes in tax rates and laws are recognized in the period in which they occur. Deferred income tax expense results from changes in deferred tax assets and liabilities between periods. Deferred tax assets are reduced by a valuation allowance if, based on the weight of evidence available, it is more likely than not that some portion or all of a deferred tax asset will not be realized. Deferred tax assets are included in other assets in the consolidated balance sheets and deferred tax liabilities are included in other liabilities in the Consolidated Balance Sheets.
Uncertain tax positions are recognized if it is more likely than not, based on the technical merits, that the tax position will be realized or sustained upon examination. The term more likely than not means a likelihood of more than 50 percent; the terms examined and upon examination also include resolution of the related appeals or litigation processes, if any. A tax position that meets the more-likely-than-not recognition threshold is initially and subsequently measured as the largest amount of tax benefit that has a greater than 50 percent likelihood of being realized upon settlement with a taxing authority that has full knowledge of all relevant information. The determination of whether or not a tax position has met the more-likely-than- not recognition threshold considers the facts, circumstances, and information available at the reporting date and is subject to management’s judgment. There were no
With a few exceptions, the Company is no longer subject to U.S. federal tax examinations by tax authorities for years before 2021, and state and local income tax examinations by tax authorities for years before 2021. For federal tax purposes, the Company recognizes interest and penalties on income taxes as a component of income tax expense.
F-33
Northpointe Bancshares, Inc.
Note 16 — Minimum Regulatory Capital Requirements
The Company and Bank are subject to various regulatory capital requirements administered by the Federal banking agencies. Failure to meet minimum capital requirements can result in certain mandatory — and possibly additional discretionary — actions by regulators that, if undertaken, could have a direct material effect on the Company’s financial statements. Under capital adequacy guidelines and the regulatory framework for prompt corrective action, the Company and Bank must meet specific capital guidelines that involve quantitative measures of the Company and the Bank’s assets, liabilities, and certain off-balance sheet items as calculated under U.S. GAAP, regulatory reporting requirements and regulatory capital standards. The Company and Bank’s capital amounts and classification are also subject to qualitative judgments by the regulators about components, risk weightings, and other factors. Furthermore, the Company and Bank’s regulators could require adjustments to regulatory capital not reflected in the consolidated financial statements.
Quantitative measures established by regulatory capital standards to ensure capital adequacy require the Company and the Bank to maintain minimum amounts and ratios (set forth in the table below) of total capital, Tier 1 capital (as defined), and common equity Tier 1 capital (as defined) to risk-weighted assets (as defined) and of Tier 1 capital (as defined) to average total assets (as defined). Additionally, to make distributions or discretionary bonus payments, the Company and Bank must maintain a capital conservation buffer of 2.5 % of risk-weighted assets.
Management believes, as of December 31, 2024 and 2023, that the Company and the Bank met all capital adequacy requirements to which it is subject. As of the latest balance sheet date, the most recent regulatory notifications categorized the Bank as well capitalized under the regulatory framework for prompt corrective action. To be categorized as well capitalized, the Bank must maintain minimum ratios as set forth in the following table. Management believes the Bank has met all capital adequacy requirements to which it is subject. There are no conditions or events since that notification that management believes have changed the institution’s category.
| As of December 31, 2024 (000s omitted) |
Actual | For Capital Adequacy Purposes |
To be Well Capitalized Under Prompt Corrective Action Provisions |
|||||||||||||||||||||||||||||||||||
| Amount | Ratio | Amount | Ratio | Amount | Ratio | |||||||||||||||||||||||||||||||||
| CET1 (to risk weighted assets) | ||||||||||||||||||||||||||||||||||||||
| Consolidated | $ | % | $ | % | N/A | N/A | ||||||||||||||||||||||||||||||||
| Northpointe Bank | % | % | $ | % | ||||||||||||||||||||||||||||||||||
| Tier 1 Capital (to risk weighted assets) | ||||||||||||||||||||||||||||||||||||||
| Consolidated | % | % | N/A | N/A | ||||||||||||||||||||||||||||||||||
| Northpointe Bank | % | % | % | |||||||||||||||||||||||||||||||||||
| Total Capital (to risk weighted assets) | ||||||||||||||||||||||||||||||||||||||
| Consolidated | % | % | N/A | N/A | ||||||||||||||||||||||||||||||||||
| Northpointe Bank | % | % | % | |||||||||||||||||||||||||||||||||||
| Tier 1 capital (to average assets) | ||||||||||||||||||||||||||||||||||||||
| Consolidated | % | % | N/A | N/A | ||||||||||||||||||||||||||||||||||
| Northpointe Bank | % | % | % | |||||||||||||||||||||||||||||||||||
F-34
Northpointe Bancshares, Inc.
Note 16 — Minimum Regulatory Capital Requirements (continued)
| As of December 31, 2023 (000s omitted) |
Actual | For Capital Adequacy Purposes |
To be Well Capitalized Under Prompt Corrective Action Provisions |
|||||||||||||||||||||||||||||||||||
| Amount | Ratio | Amount | Ratio | Amount | Ratio | |||||||||||||||||||||||||||||||||
| CET1 (to risk weighted assets) | ||||||||||||||||||||||||||||||||||||||
| Consolidated | $ | % | $ | % | $ N/A | N/A% | ||||||||||||||||||||||||||||||||
| Northpointe Bank | % | % | % | |||||||||||||||||||||||||||||||||||
| Tier 1 Capital (to risk weighted assets) | ||||||||||||||||||||||||||||||||||||||
| Consolidated | % | % | N/A | N/A% | ||||||||||||||||||||||||||||||||||
| Northpointe Bank | % | % | % | |||||||||||||||||||||||||||||||||||
| Total Capital (to risk weighted assets) | ||||||||||||||||||||||||||||||||||||||
| Consolidated | % | % | N/A | N/A% | ||||||||||||||||||||||||||||||||||
| Northpointe Bank | % | % | % | |||||||||||||||||||||||||||||||||||
| Tier 1 capital (to average assets) | ||||||||||||||||||||||||||||||||||||||
| Consolidated | % | % | N/A | N/A% | ||||||||||||||||||||||||||||||||||
| Northpointe Bank | % | % | % | |||||||||||||||||||||||||||||||||||
Note 17 — Restrictions on Dividends, Loans, and Advances
Banking regulations place certain restrictions on dividends paid and loans or advances made by the Bank to the Company. The total amount of dividends which may be paid at any date is generally limited to the retained earnings of the Bank. However, dividends paid by the Bank would be prohibited if the effect thereof would cause the Bank’s capital to be reduced below applicable minimum standards without prior approval from the bank regulators.
Note 18 — Fair Value Measurements
Accounting standards require, or allow certain assets and liabilities at fair value in the financial statements and provide a framework for establishing that fair value. The framework for determining fair value is based on a hierarchy that prioritizes the inputs and valuation techniques used to measure fair value.
In general, fair values determined by Level 1 inputs use quoted prices in active markets for identical assets that the Company has the ability to access.
Fair values determined by Level 2 inputs use other inputs that are observable, either directly or indirectly. These Level 2 inputs include quoted prices for similar assets in active markets and other inputs such as interest rates and yield curves that are observable at commonly quoted intervals.
Level 3 inputs are unobservable inputs, including inputs that are available in situations where there is little, if any, market activity for the related asset. These Level 3 fair value measurements are based primarily on management’s own estimates using pricing models, discounted cash flow methodologies, or similar techniques taking into account the characteristics of the asset.
In instances whereby inputs used to measure fair value fall into different levels in the above fair value hierarchy, fair value measurements in their entirety are categorized based on the lowest level input that is significant to the valuation. The Company’s assessment of the significance of particular inputs to these fair value measurements requires judgment and considers factors specific to each asset.
The Company records the fair values of financial assets and liabilities on a recurring and non-recurring basis using the following methods and assumptions:
Equity securities
Equity securities with readily determinable fair value are reported at fair value. Fair value for these investments is primarily determined using a quoted price in an active market or exchange (Level 1).
F-35
Available for sale debt securities
Included in the Company’s available for sale (“AFS”) debt securities are corporate bonds which are classified as Level 3 assets. The valuation of these corporate bonds is determined using broker quotes, third-party vendor prices, or other valuation techniques, such as discounted cash flow techniques. Market inputs used in the other valuation techniques or underlying third-party vendor prices or broker quotes include benchmark and government bond yield curves, credit spreads, and trade execution data.
The Company’s debt securities also includes a municipal bond which is classified as Level 2 asset. The valuation of this municipal bond, which is not actively traded, is based on a quoted price to purchase the security as part of a refinancing of the underlying bond.
Loans
Certain loans held for sale and held for investment are measured at fair value on a recurring basis due to the Company’s election to adopt fair value accounting treatment for those loans originated for which the Company has entered into certain derivative financial instruments as part of its mortgage banking and related risk management activities. These instruments include interest rate lock commitments and mandatory forward commitments to sell these loans to investors known as forward mortgage-backed securities trades. This election allows for a more effective offset of the changes in fair values of the assets and the mortgage related derivative instruments used to economically hedge them without the burden of complying with the requirements for hedge accounting under ASC 815, Derivatives and Hedging. Mortgage loans held for sale, for which the fair value option was elected, are valued using a market approach by utilizing either: (i) the fair value of securities backed by similar mortgage loans, adjusted for certain factors to approximate the fair value of a whole mortgage loan, including the value attributable to mortgage servicing and credit risk, (ii) current commitments to purchase loans or (iii) recent observable market trades for similar loans, adjusted to credit risk and other individual loan characteristics. As these prices are derived from market observable inputs, the Company classifies these valuations as Level 2 in the fair value disclosures. For mortgage loans held for sale for which the fair value option was elected, the earned current contractual interest payment is recognized in interest income, loan origination costs and fees on fair value option loans are recognized in earnings as incurred and not deferred. The Company has no continuing involvement in any residential mortgage loans sold.
Loans held for investment that are measured at fair value are those that initially were intended for sale and then transferred to portfolio. At December 31, 2024, these loans had an aggregate unpaid principal balance of $203.0 million and aggregate fair value of $173.0 million. At December 31, 2023, these loans had an aggregate unpaid principal balance of $117.4 million and aggregate fair value of $100.2 million. At December 31, 2023, the Company held $160.0 million in aggregate unpaid principal balance of loans held for sale marked on fair value accounting, which were transferred to held for investment during 2024.
F-36
At December 31, 2024 and 2023, the fair value option was applied to loans that had been transferred from held for sale to portfolio and also to mortgage loans held for sale. The fair value adjustments are reflected in Net Gain on Sale of Loans on the Company’s Consolidated Statements of Income. The table below shows the income statement impact for these fair value adjustments for the years ended December 31, 2024 and 2023.
| For the year ended December 31, | |||||||||||
| 2024 | 2023 | ||||||||||
| Loans | $ | $ | ( |
||||||||
| Loans held for sale | ( |
||||||||||
Loans reported at the fair value which were over 90 days past due amounted to $148,000 and $1.6 million in unpaid principal balance with a fair values of $145,000 and $1.5 million, respectively as of December 31, 2024 and 2023. The accrual of interest on loans is discontinued at the time the loan is delinquent (120 days for mortgages). Non-accrual loans reported at fair value amounted to $10.3 million in unpaid principal balance and $8.3 million in fair value as of December 31, 2024. Non-accrual loans reported at fair value amounted to $11.4 million in unpaid principal balance and $9.0 million in fair value as of December 31, 2023.
Interest rate lock commitments
The estimated fair values of interest rate lock commitments utilize current secondary market prices for underlying loans and estimated servicing value with similar coupons, maturity and credit quality, subject to the anticipated loan funding probability (pull-through rate). The fair value of interest rate lock commitments is subject to change primarily due to changes in interest rates and the estimated pull-through rate. Given the significant and unobservable nature of the pull-through factor, interest rate lock commitments are classified as Level 3.
Forward sales commitments
Forward mortgage-backed securities trades are exchange-traded or traded within highly active dealer markets. In order to determine the fair value of these instruments, the Company utilized the exchange price or dealer market price for the particular derivative contract; therefore these contracts are classified as Level 2. The estimated fair values are subject to change primarily due to changes in interest rates.
Mortgage Service Rights
Mortgage service rights are carried at fair value. Fair value is determined using an income approach with various assumptions including expected cash flows, market discount rates, prepayment speeds, servicing costs, and other factors. As such, MSRs are considered Level 3.
Lender Risk Account
The Company’s Lender risk account is carried at fair value. Fair value is determined using an income approach with various assumptions including expected cash flows, market discount rates, prepayment speeds, and other factors. As such, the lender risk account is considered Level 3.
F-37
The following tables present information about the Company’s assets measured at fair value on a recurring basis at December 31, 2024 and 2023 and the valuation techniques used by the Company to determine those fair values (000s omitted).
| Fair Value on a Recurring Basis at December 31, 2024 |
||||||||||||||||||||||||||
| Quoted Prices in Active Markets for Identical Assets (Level 1) |
Significant Other Observable Inputs (Level 2) |
Significant Unobservable Inputs (Level 3) |
Balance at December 31 |
|||||||||||||||||||||||
| Financial Assets: | ||||||||||||||||||||||||||
| Equity securities | $ | $ | $ | $ | ||||||||||||||||||||||
| Available for sale debt securities | ||||||||||||||||||||||||||
| Mortgage banking assets: | ||||||||||||||||||||||||||
| Loans held for sale | ||||||||||||||||||||||||||
| Loans held for Investment | ||||||||||||||||||||||||||
| Interest rate lock commitments | ||||||||||||||||||||||||||
| Forward sales commitments | ||||||||||||||||||||||||||
| Mortgage servicing rights | ||||||||||||||||||||||||||
| Lender risk account | ||||||||||||||||||||||||||
| Financial Liabilities: | ||||||||||||||||||||||||||
| Interest rate lock commitments | ||||||||||||||||||||||||||
| Forward sales commitments | ||||||||||||||||||||||||||
| Fair Value on a Recurring Basis at December 31, 2023 |
|||||||||||||||||||||||||||||
| Quoted Prices in Active Markets for Identical Assets (Level 1) |
Significant Other Observable Inputs (Level 2) |
Significant Unobservable Inputs (Level 3) |
Balance at December 31 |
||||||||||||||||||||||||||
| Financial Assets: | |||||||||||||||||||||||||||||
| Equity securities | $ | $ | $ | $ | |||||||||||||||||||||||||
| Available for sale debt securities | |||||||||||||||||||||||||||||
| Mortgage banking assets: | |||||||||||||||||||||||||||||
| Loans held for sale | |||||||||||||||||||||||||||||
| Loans held for investment | |||||||||||||||||||||||||||||
| Interest rate lock commitments | |||||||||||||||||||||||||||||
| Forward sales commitments | |||||||||||||||||||||||||||||
| Mortgage servicing rights | |||||||||||||||||||||||||||||
| Lender risk account | |||||||||||||||||||||||||||||
| Financial Liabilities: | |||||||||||||||||||||||||||||
| Interest rate lock commitments | |||||||||||||||||||||||||||||
| Forward sales commitments | |||||||||||||||||||||||||||||
The Company’s policy is to recognize transfers in and transfers out of Level 1, 2, and 3 fair value classifications as of the actual date of the event of change in circumstances that caused the transfer.
Changes in mortgage servicing rights as well as the related weighted average unobservable inputs are included in Note 5.
F-38
The following table presents a reconciliation of the Level 3 available for sale debt securities measured at fair value on a recurring basis for the years ended December 31, 2024 and 2023 (000s omitted):
| For the year ended December 31, | |||||||||||
| 2024 | 2023 | ||||||||||
| Balance at beginning of period | $ | $ | |||||||||
| Purchases | |||||||||||
| Sales | ( |
||||||||||
| Realized | ( |
||||||||||
| Unrealized | ( |
||||||||||
| Balance at end of period | $ | $ | |||||||||
The following table presents a reconciliation of the Level 3 interest rate lock commitments measured at fair value on a recurring basis for the years ended December 31, 2024 and 2023 (000s omitted):
| For the year ended December 31, | |||||||||||
| 2024 | 2023 | ||||||||||
| Balance at beginning of period | $ | $ | |||||||||
| Change in fair value | ( |
||||||||||
| Balance at end of period | $ | $ | |||||||||
The following is a summary of the key unobservable inputs used in the valuation of the Level 3 interest rate lock commitments:
| For the year ended December 31, | |||||||||||
| 2024 | 2023 | ||||||||||
| Pull-through rate | % | % | |||||||||
The following table presents a reconciliation of the Level 3 lender risk account measured at fair value on a recurring basis for the years ended December 31, 2024 and 2023 (000s omitted):
| For the year ended December 31, | |||||||||||
| 2024 | 2023 | ||||||||||
| Beginning of period | $ | $ | |||||||||
| Due to loan sales | |||||||||||
| Releases and claims paid to the Company | ( |
( |
|||||||||
| Change in fair value recognized in gain on sale of loans | |||||||||||
| End of period | $ | $ | |||||||||
Both observable and unobservable inputs may be used to determine the lender risk account fair value of position classified as Level 3 asset. As a result, the unrealized gains for these assets presented in the tables above may include changes in fair value that were attributable to both observable and unobservable inputs.
At December 31, 2024 the fair value of Level 3 mortgage servicing rights was determined using discount rates between 10.0 and 12.0 percent, average cost of servicing between $70 and $85 per file per year, and a prepayment speed of 9.7 percent. At December 31, 2023 the fair value of mortgage servicing rights was determined using discount rates between 10.0 and 12.5 percent, average cost of servicing between $70 and $85 per file per year, and a prepayment speed of 7.2 percent.
F-39
The Company estimates the fair value of the lender risk account using management’s best estimate of key assumptions. These assumptions include prepayment rates, discount rates, and projected annual losses on unpaid principal of the sold loan portfolio. The weighted average of unobservable inputs for these valuation assumptions is as follows:
| Fair Value at December 31, |
Valuation Technique |
Unobservable Inputs | Range of Inputs | Weighted Average |
|||||||||||||||||||||||||
| Assets: | |||||||||||||||||||||||||||||
| Lender Risk Account - 2024 | $ | Present value of | Credit losses | % | |||||||||||||||||||||||||
| cash flows | Prepayment rates | % | % | ||||||||||||||||||||||||||
| Discount rates | % | ||||||||||||||||||||||||||||
| Lender Risk Account - 2023 | $ | Present value of | Credit losses | % | |||||||||||||||||||||||||
| cash flows | Prepayment rates | % | % | ||||||||||||||||||||||||||
| Discount rates | % | ||||||||||||||||||||||||||||
The Company also has assets that under certain conditions are subject to measurement at fair value on a nonrecurring basis. These assets include individually analyzed loans and other real estate which are periodically reviewed for impairment and measured at fair value if the fair value of the asset is below the recorded book value. The Company has estimated the fair values of these assets based primarily on Level 3 inputs as described above.
During 2024 and 2023, the following asset classes were measured at fair value on the accompanying consolidated balance sheets due to declines in the fair value. Certain individually analyzed loans and other real estate carried at original cost, which exceeds fair value, have been omitted from the disclosure below (000s omitted):
| Assets Measured at Fair Value on a Nonrecurring Basis at December 31, 2024 |
|||||||||||||||||||||||
| Quoted Prices in Active Markets for Identical Assets (Level 1) |
Significant Other Observable Inputs (Level 2) |
Significant Unobservable Inputs (Level 3) |
Balance at December 31 |
||||||||||||||||||||
| Individually analyzed loans | $ | $ | |||||||||||||||||||||
| Other real estate owned | |||||||||||||||||||||||
| Assets Measured at Fair Value on a Nonrecurring Basis at December 31, 2023 |
|||||||||||||||||||||||
| Quoted Prices in Active Markets for Identical Assets (Level 1) |
Significant Other Observable Inputs (Level 2) |
Significant Unobservable Inputs (Level 3) |
Balance at December 31 |
||||||||||||||||||||
| Individually analyzed loans | $ | $ | |||||||||||||||||||||
| Other real estate owned | |||||||||||||||||||||||
F-40
The following presents estimated fair values of the Company’s financial instruments and the level within the fair value hierarchy in which fair value measurements falls:
| December 31, 2024 | |||||||||||||||||
| Fair Value Hierarchy | Carrying Value | Fair Value | |||||||||||||||
| Financial Assets: | |||||||||||||||||
| Cash and cash equivalents | Level 1 | $ | $ | ||||||||||||||
| Equity securities | Level 1 | ||||||||||||||||
| Debt securities available for sale | Level 3 | ||||||||||||||||
| FHLB stock | Level 2 | ||||||||||||||||
| Loans held for sale | Level 2 | ||||||||||||||||
| Loans, net | Level 3 | ||||||||||||||||
| Interest receivable | Level 2 | ||||||||||||||||
| Financial Liabilities: | |||||||||||||||||
| Deposits | Level 2 | ||||||||||||||||
| Subordinated debentures | Level 2 | ||||||||||||||||
| Subordinated debentures issues through trusts | Level 2 | ||||||||||||||||
| Borrowings | Level 2 | ||||||||||||||||
| Interest payable | Level 2 | ||||||||||||||||
| December 31, 2023 | |||||||||||||||||
| Fair Value Hierarchy | Carrying Value | Fair Value | |||||||||||||||
| Financial Assets: | |||||||||||||||||
| Cash and cash equivalents | Level 1 | $ | $ | ||||||||||||||
| Equity securities | Level 1 | ||||||||||||||||
| Debt securities available for sale | Level 3 | ||||||||||||||||
| FHLB stock | Level 2 | ||||||||||||||||
| Loans held for sale | Level 2 | ||||||||||||||||
| Loans, net | Level 3 | ||||||||||||||||
| Interest receivable | Level 2 | ||||||||||||||||
| Financial Liabilities: | |||||||||||||||||
| Deposits | Level 2 | ||||||||||||||||
| Subordinated debentures | Level 2 | ||||||||||||||||
| Subordinated debentures issues through trusts | Level 2 | ||||||||||||||||
| Borrowings | Level 2 | ||||||||||||||||
| Interest payable | Level 2 | ||||||||||||||||
Note 19 — Debt Securities
The amortized costs, fair values, and unrealized gains and losses of debt securities available for sale were as follows (000s omitted):
| December 31, 2024 | Amortized Cost | Gross Unrealized | Fair Value | |||||||||||||||||||||||
| Gains | Losses | |||||||||||||||||||||||||
Debt Securities Available for Sale(1)
|
||||||||||||||||||||||||||
| Subordinated corporate bonds | $ | $ | $ | ( |
$ | |||||||||||||||||||||
| Total | $ | $ | $ | ( |
$ | |||||||||||||||||||||
______________________
(1)As of December 31, 2024, there was no allowance for credit losses.
F-41
| December 31, 2023 | Amortized Cost | Gross Unrealized | Fair Value | |||||||||||||||||||||||
| Gains | Losses | |||||||||||||||||||||||||
Debt Securities Available for Sale(1)
|
||||||||||||||||||||||||||
| Subordinated corporate bonds | $ | $ | $ | ( |
$ | |||||||||||||||||||||
| Subordinated municipal bond | ||||||||||||||||||||||||||
| Total | $ | $ | $ | ( |
$ | |||||||||||||||||||||
______________________
(1)As of December 31, 2023, there was no allowance for credit losses.
Proceeds from the sale of debt securities available for sale were $10.9 million in 2024, resulting in a gain of $83,000 . There were no sales of debt securities available for sale in 2023.
The following tables show investments with gross unrealized losses and their market value aggregate by investment category and length of time that individual securities have been in a continuous unrealized loss position at the dates indicated (000s omitted):
| December 31, 2024 | Less Than 12 Months | 12 Months or More | Total | |||||||||||||||||||||||||||||||||||
| Fair Value | Unrealized Loss |
Fair Value | Unrealized Loss |
Fair Value | Unrealized Loss |
|||||||||||||||||||||||||||||||||
| Debt Securities Available for Sale | ||||||||||||||||||||||||||||||||||||||
| Subordinated corporate bond | $ | $ | $ | $ | ( |
$ | $ | ( |
||||||||||||||||||||||||||||||
| Total | $ | $ | $ | $ | ( |
$ | $ | ( |
||||||||||||||||||||||||||||||
| December 31, 2023 | Less Than 12 Months | 12 Months or More | Total | |||||||||||||||||||||||||||||||||||
| Fair Value | Unrealized Loss |
Fair Value | Unrealized Loss |
Fair Value | Unrealized Loss |
|||||||||||||||||||||||||||||||||
| Debt Securities Available for Sale | ||||||||||||||||||||||||||||||||||||||
| Subordinated corporate bond | $ | $ | $ | $ | ( |
$ | $ | ( |
||||||||||||||||||||||||||||||
| Total | $ | $ | $ | $ | ( |
$ | $ | ( |
||||||||||||||||||||||||||||||
Debt securities, at par value, have the following contractual maturities (000s omitted):
| December 31, 2024 | ||||||||||||||||||||||||||||||||
| Within 1 Year |
1 - 5 Years | 5 - 10 Years | Greater than 10 years |
Total | ||||||||||||||||||||||||||||
| Debt Securities Available for Sale | ||||||||||||||||||||||||||||||||
| Subordinated corporate bond | $ | $ | $ | $ | $ | |||||||||||||||||||||||||||
| Total | $ | $ | $ | $ | $ | |||||||||||||||||||||||||||
F-42
Note 20 — Related Parties
Loans to principal officers, directors, and their affiliates during 2024 were as follows (000s omitted):
| Beginning Balance | $ | ||||
| New loans and advances | |||||
| Repayments and changes in officers or directors | ( |
||||
| Ending Balance | $ | ||||
Deposits from principal officers, directors, and their affiliates were $3.8 million at December 31, 2024 and $3.9 million at December 31, 2023.
Note 21 — Earnings Per Share
The following table presents the computation of basic and diluted earnings per share ($ 000s omitted):
| December 31, | |||||||||||
| 2024 | 2023 | ||||||||||
| Earnings per Common Share: | |||||||||||
| Net income | $ | $ | |||||||||
| Preferred stock dividends | |||||||||||
| Net income available to common stockholders | $ | $ | |||||||||
| Weighted average common shares | |||||||||||
| Earnings per common share | $ | $ | |||||||||
| Dilutive Earnings Per Common Share: | |||||||||||
| Net income available to common stockholders | $ | $ | |||||||||
| Weighted average common shares | |||||||||||
| Effect of dilutive shares | |||||||||||
| Weighted average dilutive common shares | |||||||||||
| Dilutive earnings per common share | $ | $ | |||||||||
Note 22 — Segment Information
The following disclosures reflect the adoption of ASU 2023-07, see Note 2 Accounting Policies for additional information related to our adoption of this ASU.
Our reportable segments are Mortgage Purchase Program (“MPP”) and Retail Banking, which have been determined based on management’s focus and internal reporting structure. The MPP segment provides a collateralized mortgage purchase facility marketed to independent mortgage bankers nationwide. The Retail Banking segment provides a vast array of financial products and services to consumers nationwide. These include residential mortgages, AIO equity loans, other consumer loans, and loan servicing, as well as various types of deposit products, including checking, savings and time deposit accounts. The residential mortgage loans we originate are directly originated within our branch network or from our consumer direct business, and are typically underwritten to agency and/or third-party standards, and either sold (servicing retained or released) or held on our balance sheet.
Net interest income in each segment reflects our internal funds transfer pricing (“FTP”) methodology, which is designed to capture interest rate and liquidity risk. Under our methodology, average assets, net of deposits, receive a funding charge based on market interest rates of similar duration liabilities. MPP receives an FTP charge and the residual gain is retained within Retail Banking.
Provision (benefit) for credit losses is allocated to MPP based on the cumulative expected loss rate from the Company’s allowance for credit loss process and applied to any change in period end loan balances.
F-43
Financial results are presented, to the extent possible, as if each business operated on a standalone basis, and includes expense allocations for corporate overhead services used by the business segments. Shared corporate overhead expenses reside in Retail Banking but are allocated back to MPP through our expense allocation based on occupancy rates and percentage of time spent supporting the segment.
Results of the Company’s operating segments are regularly reviewed by the Company’s Chief Operating Decision Maker (the “CODM”), the Company’s Chief Executive Officer. More specifically, the CODM analyzes quarterly financial results, including net income, to assess performance and allocate resources. However, the CODM may use other metrics and ad hoc reports on a limited purpose basis as needed.
In evaluating segment performance, the Company primarily evaluates total revenues (net interest income plus non-interest income) and net income before preferred dividends.
The following tables present the operating segment results (000s omitted):
| For the year ended December 31, 2024 | |||||||||||||||||
| Retail Banking |
MPP | Total | |||||||||||||||
| Interest Income | $ | $ | $ | ||||||||||||||
| Interest Expense | ( |
( |
|||||||||||||||
| Funds Transfer Pricing | ( |
||||||||||||||||
| Net Interest Income | |||||||||||||||||
| Provision (benefit) for credit losses | ( |
( |
|||||||||||||||
| Net interest income after provision (benefit) for credit losses | |||||||||||||||||
| Noninterest income (1) | |||||||||||||||||
| Salaries and employee benefits | ( |
( |
( |
||||||||||||||
| Occupancy and equipment | ( |
( |
( |
||||||||||||||
| Other noninterest expense (2) | ( |
( |
( |
||||||||||||||
| Noninterest expense | ( |
( |
( |
||||||||||||||
| Expense allocation (3) | ( |
||||||||||||||||
| Net Income before taxes | |||||||||||||||||
| Income tax expense | ( |
( |
( |
||||||||||||||
| Net Income before preferred dividends | $ | $ | $ | ||||||||||||||
| Average Balance Sheet Assets | $ | $ | $ | ||||||||||||||
| Period Ending Assets | $ | $ | $ | ||||||||||||||
(1) Noninterest income for MPP only includes MPP related fees. All other noninterest income revenues are reflected in Retail Banking.
(2) Includes data processing, professional services, office supplies and other miscellaneous expenses.
(3) Reflects corporate overhead expense allocations used by both business segments; primarily consisting of corporate admin, finance, technology, human resources, risk, marketing and occupancy related allocations.
F-44
| For the year ended December 31, 2023 | |||||||||||||||||
| Retail Banking |
MPP | Total | |||||||||||||||
| Interest Income | $ | $ | $ | ||||||||||||||
| Interest Expense | ( |
( |
|||||||||||||||
| Funds Transfer Pricing | ( |
||||||||||||||||
| Net Interest Income | |||||||||||||||||
| Provision (benefit) for credit losses | ( |
( |
|||||||||||||||
| Net interest income after provision (benefit) for credit losses | |||||||||||||||||
| Noninterest income (1) | |||||||||||||||||
| Salaries and employee benefits | ( |
( |
( |
||||||||||||||
| Occupancy and equipment | ( |
( |
( |
||||||||||||||
| Other noninterest expense (2) | ( |
( |
( |
||||||||||||||
| Noninterest expense | ( |
( |
( |
||||||||||||||
| Expense allocation (3) | ( |
||||||||||||||||
| Net Income before taxes | |||||||||||||||||
| Income tax expense | ( |
( |
( |
||||||||||||||
| Net Income before preferred dividends | $ | $ | $ | ||||||||||||||
| Average Balance Sheet Assets | $ | $ | $ | ||||||||||||||
| Period Ending Assets | $ | $ | $ | ||||||||||||||
(1) Noninterest income for MPP only includes MPP related fees. All other noninterest income revenues are reflected in Retail Banking.
(2) Includes data processing, professional services, office supplies and other miscellaneous expenses.
(3) Reflects corporate overhead expense allocations used by both business segments; primarily consisting of corporate admin, finance, technology, human resources, risk, marketing and occupancy related allocations.
Note 23 — Parent Company Condensed Financial Statements
The following are the condensed financial statements of Northpointe Bancshares, Inc. (Parent only) (000s omitted):
Condensed Balance Sheets
| December 31, 2024 | December 31, 2023 | ||||||||||
| Assets | |||||||||||
| Cash and cash equivalents | $ | $ | |||||||||
| Investment in subsidiary | |||||||||||
| Other assets | |||||||||||
| Total Assets | $ |
|
$ |
|
|||||||
| Liabilities and Stockholders' Equity | |||||||||||
| Liabilities | |||||||||||
| Subordinated debentures (Note 11) | $ | $ | |||||||||
| Subordinated debentures issues through trusts (Note 12) | |||||||||||
| Accrued and other liabilities | |||||||||||
| Total Liabilities | |||||||||||
| Stockholders' Equity | |||||||||||
| Total Liabilities and Stockholders' Equity | $ |
|
$ |
|
|||||||
F-45
Northpointe Bancshares, Inc.
Note 23 — Parent Company Condensed Financial Statements (Continued)
Condensed Statements of Income
| Years Ended December 31, | |||||||||||
| 2024 | 2023 | ||||||||||
| Income | |||||||||||
| Dividends and return of capital from subsidiary | $ | $ | |||||||||
| Other | |||||||||||
| Total income | |||||||||||
| Expense | |||||||||||
| Interest expense | |||||||||||
| Other | |||||||||||
| Total expense | |||||||||||
| Income - Before Income Taxes | |||||||||||
| Income Tax (Benefit) Expense | ( |
( |
|||||||||
| Net Income | |||||||||||
| Preferred Stock Dividends | |||||||||||
| Net Income available to common stockholders | $ |
|
$ |
|
|||||||
Condensed Statements of Cash Flows
| Years Ended December 31, | |||||||||||
| 2024 | 2023 | ||||||||||
| Operating Activities | |||||||||||
| Net Income | $ | $ | |||||||||
| Adjustments to reconcile net income to net cash provided by (used in) operating activities: | |||||||||||
| Equity in undistributed earnings of subsidiaries | ( |
( |
|||||||||
| Other, net | ( |
||||||||||
| Net cash provided by operating activities | |||||||||||
| Investing Activities | |||||||||||
| Net cash used in investing activities | |||||||||||
| Financing Activities | |||||||||||
| Cash dividends paid on common stock | ( |
( |
|||||||||
| Subordinated debt repurchase | ( |
( |
|||||||||
| Subordinated debt issuance, net of costs | |||||||||||
| Preferred stock dividend | ( |
( |
|||||||||
| Preferred stock repurchase | ( |
||||||||||
| Stock repurchased | ( |
( |
|||||||||
| Proceeds from exercised stock options | |||||||||||
| Net cash (used in) provided by financing activities | ( |
( |
|||||||||
| Net (Decrease) Increase in Cash and Cash Equivalents | ( |
( |
|||||||||
Cash and Cash Equivalents - Beginning of year
|
|||||||||||
Cash and Cash Equivalents - End of year
|
$ |
|
$ |
|
|||||||
F-46
Item 9. Changes in and Disagreements With Accountants on Accounting and Financial Disclosures
None
Item 9A. Controls and Procedures
(a) Evaluation of Disclosure Controls and Procedures.
Under the supervision of and with the participation of our management, including our Chief Executive Officer (“CEO”) and Chief Financial Officer (“CFO”), we conducted an evaluation of the effectiveness of the design and operation of our disclosure controls and procedures, as defined in Rules 13a-15(e) and 15d-15(e) of the Securities Exchange Act of 1934 (Exchange Act), as of December 31, 2024. In designing and evaluating the disclosure controls and procedures, management recognizes that any controls and procedures, no matter how well designed and operated, can provide only reasonable assurance of achieving the desired control objectives, as the Company’s are designed to do, and management necessarily was required to apply its judgment in evaluating whether the benefits of the controls and procedures that the Company adopts outweigh their costs. Our management, including our CEO and CFO, after evaluating the effectiveness of the Company's disclosure controls and procedures, have concluded that, as of December 31, 2024, the Company's disclosure controls and procedures were effective to ensure that information required to be disclosed by us in the reports that we file under the Exchange Act is recorded, processed, summarized and reported within time periods specified in the Commission's rules and forms.
(b) Changes in Internal Controls.
Other than the remediated material weakness identified by management and described below, there were no changes to the Company’s internal control over financial reporting (as such term is defined in Rule 13a-15(e) and 15d-15(f) under the Exchange Act) during the fourth quarter of 2024 that have materially affected, or are reasonably likely to materially affect, the Company’s internal control over financial reporting.
(c) Management's Report on Internal Control over Financial Reporting.
The management of the Company is responsible for establishing and maintaining adequate internal control over financial reporting. The Company’s internal control system was designed by, or under the supervision of, our CEO and CFO and effected by our Board of Directors, management and other personnel to provide reasonable assurance regarding the reliability of financial reporting and the preparation of consolidated financial statements and related notes for external purposes in accordance with generally accepted accounting principles in the United States of America.
An internal control system, no matter how well designed, has inherent limitations. Therefore, even those systems determined to be effective can provide only reasonable, not absolute, assurance that the control system’s objectives have been met. The inherent limitations include the realities that judgments in decision-making can be deficient and breakdowns can occur because of simple errors or mistakes. Because of the inherent limitations in all control systems, no evaluation of controls can provide absolute assurance that all control issues, errors and instances of fraud, if any, within the Company have been detected.
A material weakness is a deficiency, or a combination of deficiencies, in internal control over financial reporting, such that there is a reasonable possibility that a material misstatement of the Company’s annual or interim financial statements will not be prevented or detected on a timely basis.
In reporting the Company’s December 31, 2023 consolidated financial statements in the Company’s registration of shares on Form S-1, the Company’s management identified a material weakness related to controls around financial reporting of mortgage banking income that allowed gains from establishment of mortgage servicing rights to be reported as part of loan servicing income rather than gain on sale of loans. During the fourth quarter of 2024, the Company implemented a remediation plan to address the material weakness which included additional management review and system checks prior to closing each month’s financial records. During the fourth quarter of 2024, management performed procedures to ensure all reclassifications were made and revised amounts and disclosures were accurate in the Form 10-K at December 31, 2024 and 2023. As of December 31, 2024, the enhanced suite of controls associated with reporting mortgage banking income appear to be adequate and the aforementioned material weakness was considered to be remediated.
Company management assessed the effectiveness of the Company’s internal control over financial reporting as of December 31, 2024. In making this assessment, it used the criteria set forth by the Committee of Sponsoring Organizations of the Treadway Commission (COSO) in Internal Control-Integrated Framework (2013). Based on this assessment, management
68
concluded that the Company maintained effective internal control over financial reporting as of December 31, 2024 based on those criteria.
Item 9B. Other Information
During the fourth quarter of 2024, none of our other executive officers or directors adopted terminated
Item 9C. Disclosure Regarding Foreign Jurisdiction that Prevent Inspections
Not applicable.
69
Part III
Item 10. Directors, Executive Officers and Corporate Governance
The information under the headings “The Board of Directors - General, - Qualifications and Biographical Information, and - Board Committees - Audit Committee,” “Executive Officers,” “Delinquent Section 16(a) Reports”, “Corporate Governance - Code of Ethics”, and “Stockholder Proposals” in our definitive Proxy Statement relating to our May 15, 2025 Annual Meeting of Stockholders is incorporated herein by reference.
We have an Insider Trading Policy that governs the purchase, sale, and/or other disposition of the Company's securities that applies to all directors, officers, employees, certain other covered persons, and the Company itself. The Company believes that our insider trading policy and procedures are reasonably designed to promote compliance with insider trading laws, rules, and regulations, and listing standards applicable to the Company. A copy of the Company’s insider trading policy is filed as Exhibit 19 to this Report.
Item 11. Executive Compensation
Information under the heading “Executive Compensation” in our definitive Proxy Statement relating to our May 15, 2025 Annual Meeting of Stockholders is incorporated herein by reference.
Item 12. Security Ownership of Certain Beneficial Owner and Management and Related Stockholder Matters
Information under the heading “Ownership of Northpointe Stock” in our definitive Proxy Statement relating to our May 15, 2025 Annual Meeting of Stockholders is incorporated herein by reference.
The following table sets forth certain information regarding the Company’s equity compensation plans as of December 31, 2024. The following information has been adjusted to reflect the effect of all stock dividends and stock splits.
| Equity Compensation Plan Information | ||||||||||||||||||||
| Plan Category | (a) Number of securities to be issued upon exercise of outstanding options, warrants and rights | (b) Weighted-average exercise price of outstanding options, warrants and rights | (c) Number of securities remaining available for future issuance under equity compensation plans (excluding securities reflected in column (a)) | |||||||||||||||||
| Equity compensation plans approved by security holders (1) | 868,530 | $ | 38,000 | 3,150,470 | ||||||||||||||||
| Equity compensation plans not approved by security holders | — | — | — | |||||||||||||||||
| Total | 868,530 | $ | 38,000 | 3,150,470 | ||||||||||||||||
(1) Consists of the Northpointe Bancshares, Inc. Omnibus Incentive Plan. The number of shares reflected in column (c ) above with respect to the Northpointe Bancshares, Inc. Omnibus Incentive Plan represents shares that may be issued other than upon the exercise of an outstanding option, warrant or right. This plan contains customary anti-dilution provisions that are applicable in the event of a stock split or certain other changes in capitalization.
Item 13. Certain Relationships and Related Transactions, and Director Independence
Information under the headings “Transactions with Related Persons” and “The Board of Directors - Board Committees” in our definitive Proxy Statement relating to our May 15, 2025 Annual Meeting of Stockholders is incorporated herein by reference.
70
Item 14. Principal Accounting Fees and Services
Information under the headings “Independent Auditors - Fees and - Audit Committee Approval Policies” in our definitive Proxy Statement relating to our May 15, 2025 Annual Meeting of Stockholders is incorporated herein by reference.
71
Part IV
Item 15. Exhibits, Financial Statement Schedules
(a)(1) Financial Statements.
The following documents are filed as part of this Annual Report on Form 10-K
•(A) Report of Independent Registered Public Accounting Firm
•(B) Consolidated Balance Sheets at December 31, 2024 and 2023
•(C) Consolidated Statements of Income for the years ended December 31, 2024 and 2023
•(D) Consolidated Statements of Comprehensive Income for the years ended December 31, 2024 and 2023
•(E) Consolidated Statements of Changes in Stockholders’ Equity for the years ended December 31, 2024 and 2023
•(F) Consolidated Statements of Cash Flows for the years ended December 31, 2024 and 2023
•(G) Notes to the Consolidated Financial Statements
(a)(2) Financial Statement Schedules.
None.
(a)(3) Listing of Exhibits.
PLEASE NOTE: It is inappropriate for readers to assume the accuracy of, or rely upon any covenants, representations or warranties that may be contained in agreements or other documents filed as Exhibits to, or incorporated by reference in, this report. Any such covenants, representations or warranties may have been qualified or superseded by disclosures contained in separate schedules or exhibits not filed with or incorporated by reference in this report, may reflect the parties’ negotiated risk allocation in the particular transaction, may be qualified by materiality standards that differ from those applicable for securities law purposes, may not be true as of the date of this report or any other date, and may be subject to waivers by any or all of the parties. Where exhibits and schedules to agreements filed or incorporated by reference as Exhibits hereto are not included in these Exhibits, such exhibits and schedules to agreements are not included or incorporated by reference herein.
The following Exhibits are attached hereto or incorporated by reference herein (unless indicated otherwise, all documents referenced below were filed pursuant to the Exchange Act by Northpointe Bancshares, Inc.:
List of Exhibits
72
| 4.5 | ||||||||
| 4.6 | ||||||||
| 4.7 | ||||||||
| 4.8 | ||||||||
| 4.9 |
Registration Rights Agreement, dated December 30, 2021, by and between the Company and the purchasers named therein. Previously filed with the Commission on February 7, 2025 in Northpointe Bancshares, Inc.’s Form S-1, Exhibit 4.8. Here incorporated by reference.
The other instruments defining the rights of the long-term debt securities of the Registrant and its subsidiaries are omitted pursuant to section (b)(4)(iii)(A) of Item 601 of Regulation S-K. The Registrant hereby agrees to furnish copies of these instruments to the SEC upon request.
|
|||||||
| 10.1 * | ||||||||
| 10.2 * | ||||||||
| 10.3 * | ||||||||
| 10.4 * | ||||||||
| 10.5 * | ||||||||
| 10.6 * | ||||||||
| 10.7* | ||||||||
| 10.8 | ||||||||
| 10.9 | ||||||||
| 19 | ||||||||
| 21 | ||||||||
| 23.1 | ||||||||
73
| 24.1 | Power of Attorney contained on the signature pages of this 2024 Annual Report on Form 10-K and incorporated herein by reference | |||||||
| 31.1 | ||||||||
| 31.2 | ||||||||
| 32.1 | ||||||||
| 97 | ||||||||
| 101 | Interactive Data File | |||||||
| 104 | Cover Page Interactive Data File (formatted as inline XBRL and included in Exhibit 101) | |||||||
______________________
*Management contract or compensatory plan.
†Certain of the exhibits and schedules to this Exhibit have been omitted in accordance with Regulation S-K Item 601(a)(5). The Registrant agrees to furnish a copy of all omitted exhibits and schedules to the SEC upon its request.
(b) Exhibits.
The response to this portion of Item 15 is submitted under item (a)(3) above.
(c) Financial Statement Schedules.
None.
Item 16. Form 10-K Summary:
None.
74
SIGNATURES
Pursuant to the requirements of Section 13 or 15(d) of the Securities Exchange Act of 1934, the registrant has duly caused this report to be signed on its behalf by the undersigned, thereunto duly authorized.
| NORTHPOINTE BANCSHARES, INC. | |||||
| By: | /s/ Charles A. Williams | ||||
| Charles A. Williams Chairman and Chief Executive Officer |
|||||
Date: March 28, 2025
POWER OF ATTORNEY
KNOW ALL PERSONS BY THESE PRESENTS, that each person whose signature appears below constitutes and appoint Charles A. Williams and Bradley T. Howes, and each one of them, as his or her true and lawful attorneys-in- fact and agents, with full power of substitution and resubstitution, to execute in his or her name an Annual Report of Northpointe Bancshares, Inc. on Form 10-K for its fiscal year ended December 31, 2024, and any amendments to that report, and to file it with the Securities and Exchange Commission. Each attorney shall have power and authority to do and perform in the name and on behalf of the undersigned, in any and all capacities, every act to be done in the premises as fully and to all intents and purposes as the undersigned could do in person, and the undersigned hereby ratifies and approves the acts of such attorneys.
75
Pursuant to the requirements of the Securities Act of 1933, as amended, this report has been signed below by the following persons in the capacities and on the dates indicated.
| Name | Position | Date | ||||||||||||
| /s/ Charles A. Williams | Founder, Chairman and Chief Executive Officer and Director |
March 28, 2025 | ||||||||||||
| Charles A. Williams | (Principal Executive Officer) | |||||||||||||
| /s /Kevin J. Comps | President | March 28, 2025 | ||||||||||||
| Kevin J. Comps | ||||||||||||||
| /s /Bradley T. Howes | Executive Vice President and Chief Financial Officer | March 28, 2025 | ||||||||||||
| Bradley T. Howes | (Principal Financial Officer) | |||||||||||||
| /s /Gary Dykstra | Senior Vice President and Controller | March 28, 2025 | ||||||||||||
| Gary Dykstra | (Principal Accounting Officer) | |||||||||||||
| /s/ Carrie L. Boer | Director | March 28, 2025 | ||||||||||||
| Carrie L. Boer | ||||||||||||||
| /s/ Robert W. De Vlieger II | Director | March 28, 2025 | ||||||||||||
| Robert W. De Vlieger II | ||||||||||||||
| /s/ R. Jeffery Dean | Director | March 28, 2025 | ||||||||||||
| R. Jeffery Dean | ||||||||||||||
| /s/ Bruce L. Edger | Director | March 28, 2025 | ||||||||||||
| Bruce L. Edger | ||||||||||||||
| /s/ John M. Eggemeyer III | Director | March 28, 2025 | ||||||||||||
| John M. Eggemeyer III | ||||||||||||||
| /s/ David S. Hooker | Director | March 28, 2025 | ||||||||||||
| David S. Hooker | ||||||||||||||
76